Beat the Heat and Save Money Doing It; Make a Plan Now to Avoid Heat Stress
It’s never too early to start thinking about management strategies to minimize the impact of summer heat on cows. It just takes one real hot period of heat to put a big dent in milk production and reproductive performance. Last summer in 2015, Sunnyside, WA saw 45 days above 90°F, and 10 days above 100°F (NOAA). Sunnyside, WA normally sees approximately 38 days above 90°F (period of 1895 to 2013; NOAA). The highest temperature last summer reached 108°F on June 28, 2015. That record hot day wasn’t in late July or early August, as normally expected, but was in June, and was also part of a 9 day stretch of high temps above 99°F degrees.
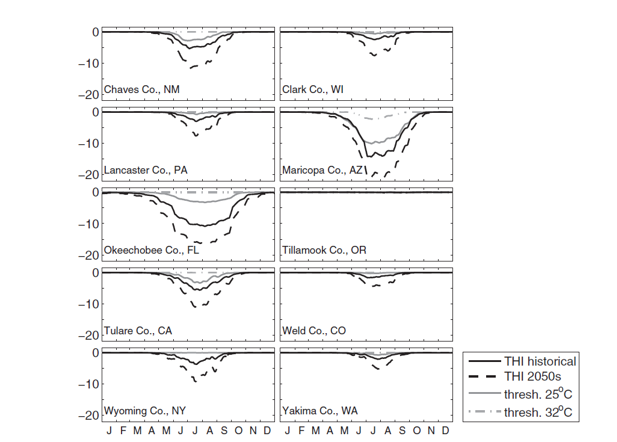
In addition to extreme heat waves, warming temperatures associated with climate change will enhance the negative impact to milk production; considering dairy cattle are extremely vulnerable to extreme high temperatures and humidity. A study investigating the impact of climate change on milk production found that concentrated dairy farming areas that are currently experiencing the greatest heat related impacts (e.g., Arizona, Florida) are also predicted to experience the greatest additional losses with climate change (Mauger, et. al., 2014). Figure 1 (below) demonstrates the loss of milk production on an annual scale comparing the historical temperature humidity index (THI) to the THI projected in 2050 with climate projections for selected concentrated dairy farming regions in the U.S. In the next 30 years, the Yakima region would expect an impact of approximately 13 lb (6kg) of milk loss/cow/day.
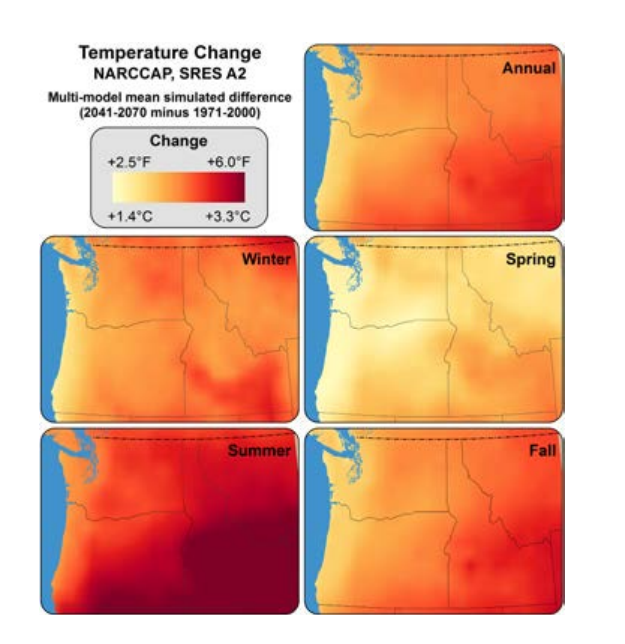
Adapting to hotter periods of heat, and more frequent periods of heat during the summer months is a critical reality to avoid economic losses. The USDA Economic Research Service (Key, et. al., 2014) found in 2010, that the impact of heat stress caused the average US dairy about $39,000. Climate models project that heat stress will “cause production loss to almost all US dairies, with 4 to 18 percent of dairies experiencing a loss greater than 2%” (Key, et. al., 2014). Figure 2 (below) shows a visual scale of projected temperature change for each season (Implications of Climate Change in the Pacific Northwest, Island Press, 2013). It is clear that summer will become the critical season for dairies to build resiliency on their operation, and beat heat stress.
Adapting to extreme periods of heat will prove to be the key piece to avoid harsh economic losses in a changing climate (Mauger, et. al, 2013; Key, et. al., 2014). Cooling methods such as shades, fans, ventilation and easy access to fresh water are essential to cooling cows, but the industry is seeing more and more producers adopt evaporative cooling systems to cope through the high temperatures. Some examples of evaporative cooling systems on dairies are soakers, misters, foggers, cooling stall pads and cooling barn walls. Evaporative cooling occurs when water is evaporated, and the energy (heat) used to evaporate the water cools the evaporative source (skin or the air, depending on the method). Farmers that have invested in heat stress abatement strategies say the initial investment is well worth the money, and pays for itself quickly. Take a few minutes to see how J &K Dairy farm in Sunnyside, WA made the decision to invest in soaker cooling technology by clicking on the link below.
With the periods of heat increasing, and arriving earlier in the summer and later into the fall, it is necessary that dairies are prepared to cool their cows effectively and efficiently to maintain healthy cows and keep profit margins. In the video link below, Joe Harrison (Washington State University), Jay Gordon (WA State Dairy Federation) Guillaume Mauger (University of Washington), and Jason Sheehan (J&K Dairy, LLC) are interviewed to provide information and education on the topic of climate change impacting dairy production and how producers are successfully adapting to the heat.
An adaptation guide planning workbook specifically designed for animal agriculture is available online to assist in identifying farm vulnerabilities to climate associated risks. This workbook is available to help producers, consultants and advisors make decisions to build resiliency on an individual livestock operation.
For more on animal agriculture and climate change, visit extension.org/60702
References
- Dalton, M., P.W. Mote, and A.K. Snover, eds., 2013: Climate Change in the Northwest: Implications for Our Landscapes, Waters, and Communities. Pg. 36. Island Press.
- Key, Nigel, Stacy Sneeringer, and David Marquardt. Climate Change, Heat Stress, and U.S. Dairy Production, ERR-175, U.S. Department of Agriculture, Economic Research Service, September 2014.
- Mauger, G.S., Bauman, Y., T. Nennich and E.P. Salathe’. 2014. Impacts of climate change on milk production. Professional Geographer, doi:10.1080/00330124.2014.921017
- National Oceanic and Atmospheric Administration, Sunnyside Station (GHCND: USC 00458211) Record of Climatological Observations, National Center for Environmental Information, 151 Patton Ave, Asheville, NC 28801 www.ncdc.noaa.gov
Results of the 2014 NAHMS Dairy Study
The USDA’s Animal and Plant Health Inspection Service is responsible for the National Animal Health Monitoring System (NAHMS). Each year, NAMHS focuses on a different aspect of the livestock industry to study. The dairy industry was studied in 1992, 1996, 2002, 2007, and 2014. A calf component was added to the 2014 study; data collection lasted from 2014-2015 and these results will be shared in a future article.
Objectives for the 2014 study were determined with input from consultants, producers, veterinarians, Extension educators, and university faculty. The selected objectives were:
- Describe trends in dairy cattle health and management practices.
- Describe management practices and production measures related to animal welfare.
- Estimate within-herd prevalence of lameness and evaluate housing and management factors associated with lameness.
- Evaluate heifer calf health from birth to weaning.
- Describe antimicrobial use and residue prevention methods used to ensure milk and meat quality.
- Estimate the prevalence and antimicrobial resistance patterns of select foodborne pathogens.
To kick off the 2014 Dairy Study, an extensive questionnaire was completed by participating producers, then an additional in depth, on-farm survey was conducted; this survey focused on farm usage of veterinarians and antimicrobials, among other topics. Trained NAHMS representatives also conducted on-farm cow evaluations (lameness scores, hock scores, and body condition scores) and collected samples (composite fecals, bulk tank samples, and milk filters) for testing.
Data was collected from 17 of the major U.S. dairy states and represent 77% of dairy farms and 80% of dairy cows. In Washington, 110 dairy farms were invited to complete the questionnaire, which 41 completed. Eleven farms participated in the on-farm survey, cow evaluation, and sample collection.
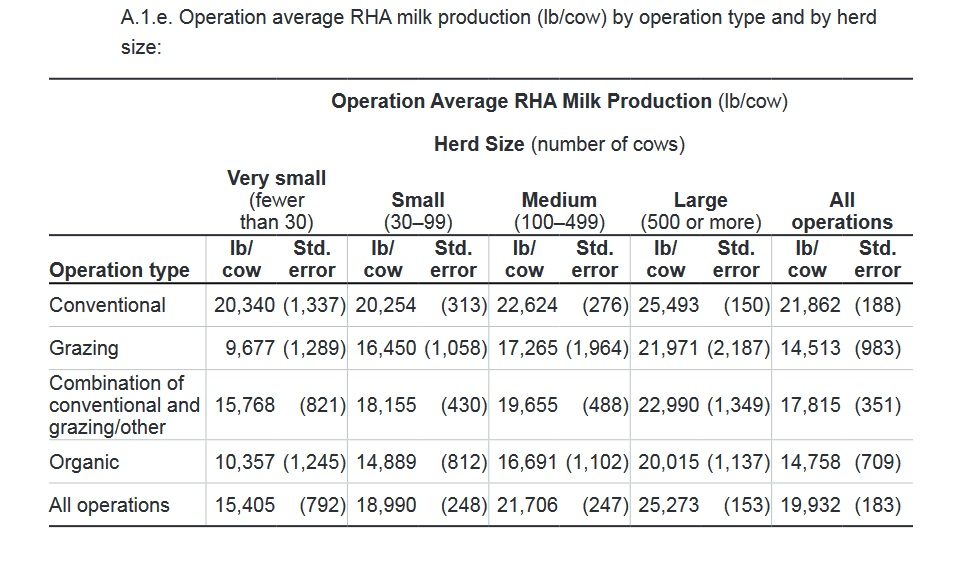
Dr. Jason Lombard of USDA APHIS led the dairy study and is overseeing data analysis and publications. “Dairy Cattle Management Practices in the United States, 2014” (pdf) is the first publication produced by NAHMS using the study data. The selected graphics below are excerpted from that publication. Data are reported according to production system (conventional, grazing, combination, or organic) and farm size (very small, small, medium, large). Some comparisons are made between eastern and western U.S. herds.
| Operation type | Operation Average RHA Milk Production (lb/cow) | |||||||||
|---|---|---|---|---|---|---|---|---|---|---|
| Herd Size (number of cows) | ||||||||||
| Very small (< 30) |
Small (30-99) |
Medium (100-499) |
Large (>500) |
All operations | ||||||
| lb/cow | Std. error | lb/cow | Std. error | lb/cow | Std. error | lb/cow | Std. error | lb/cow | Std. error | |
| Conventional | 20,340 | (1,337) | 20,254 | (313) | 22,624 | (276) | 25,493 | (150) | 21,862 | (188) |
| Grazing | 9,677 | (1,289) | 16,450 | (1,058) | 17,265 | (1,964) | 21,971 | (2,187) | 14,513 | (983) |
| Combination of conventional and grazing/other | 15,768 | (821) | 18,155 | (430) | 19,655 | (488) | 22,990 | (1,349) | 17,815 | (351) |
| Organic | 10,357 | (1,245) | 14,889 | (812) | 16,691 | (1,102) | 20,015 | (1,137) | 14,758 | (709) |
| All operations | (792) | 15,405 | 18,990 | (248) | 21,706 | (247) | 25,273 | (153) | 19,932 | (183) |
Operation Average Percent Cows
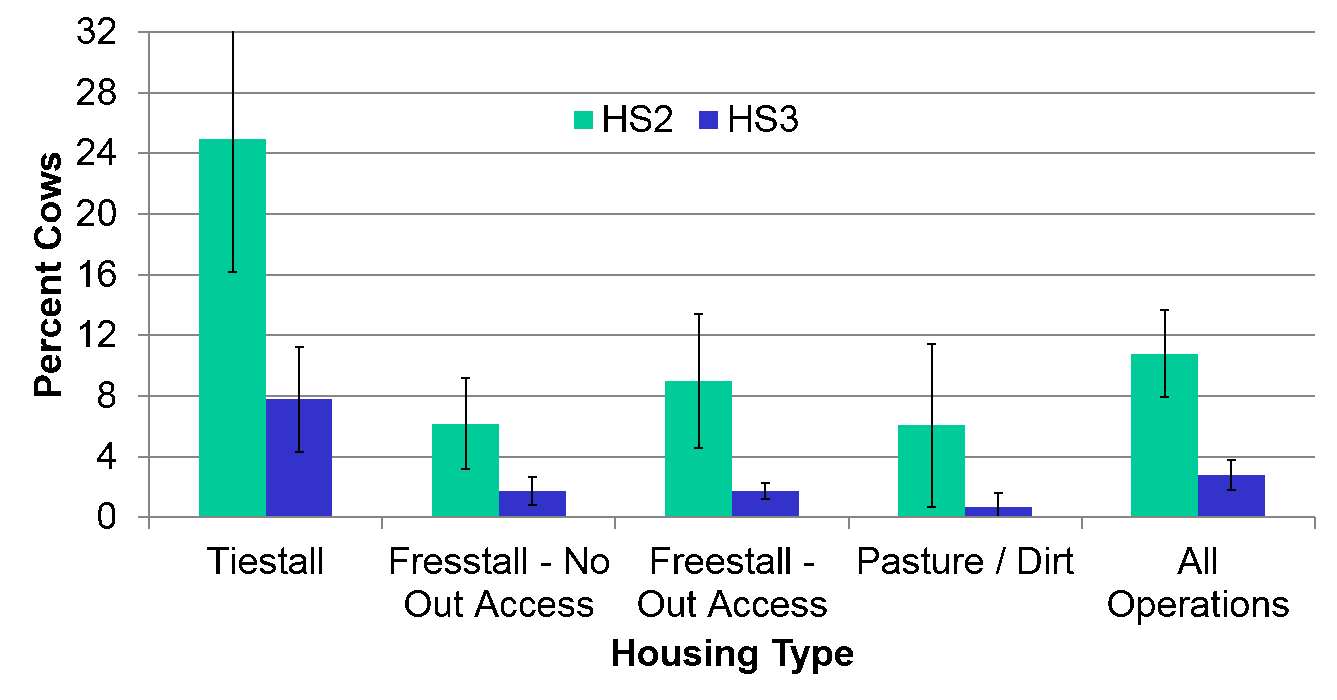
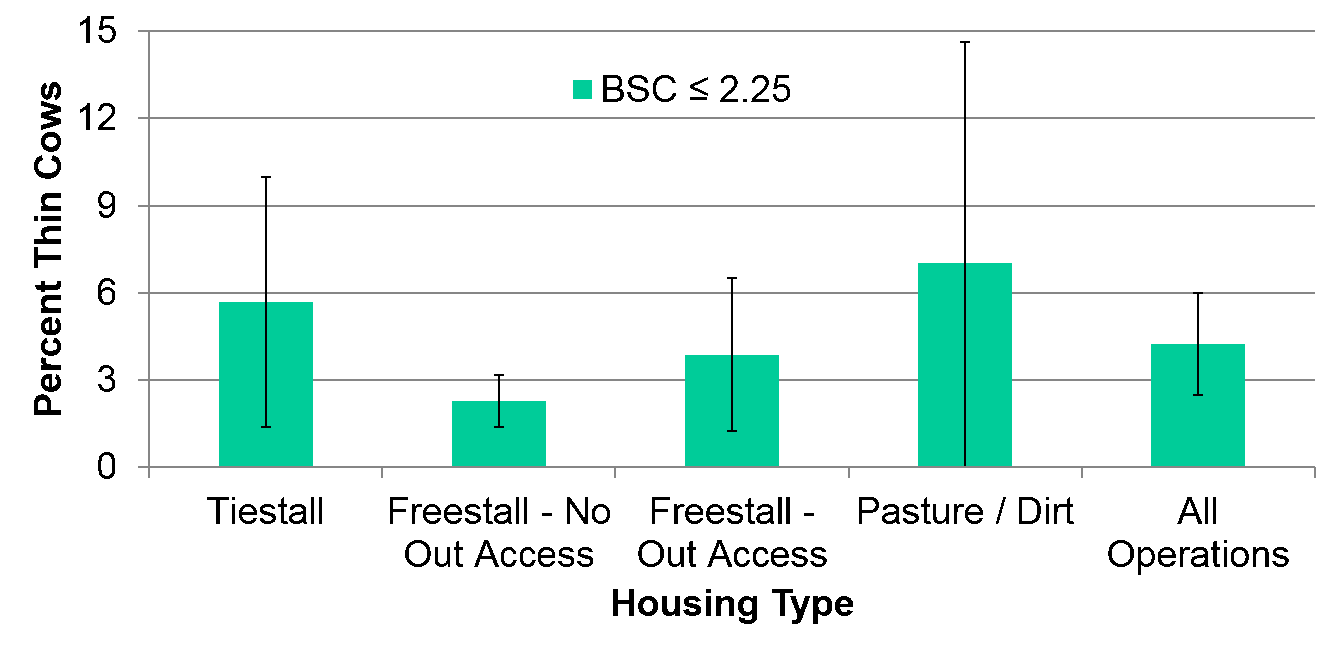
Table 2. Operation average within-herd prevalence of cows by locomotion score, hock score and low body condition score and by herd size. Locomotion Scores (lameness) according to housing type. LS1 = lameness score 1 (no lameness); LS2 = lameness score 2 (mild/moderate lameness); LS3 = lameness score 3 (severe lameness).| Evaluation Parameter | Herd Size (number of cows) | Region | ||||||||||
|---|---|---|---|---|---|---|---|---|---|---|---|---|
| Small (30-99) | Medium (100-499) | Large (500 or more) | West | East | All Operations | |||||||
| Pct. | Std. error | Pct. | Std. error | Pct. | Std. error | Pct. | Std. error | Pct. | Std. error | Pct. | Std. error | |
| Locomotion score | ||||||||||||
| Sound (LS=1) | 90 | -1.5 | 89.5 | -1.5 | 92.2 | -0.7 | 92.3 | -1.1 | 89.9 | -1 | 90.2 | -0.9 |
| Mild/moderately lame (LS=2) | 7.7 | -1.4 | 7.3 | -0.9 | 6 | -0.5 | 6.3 | -1 | 7.4 | -0.8 | 7.2 | -0.7 |
| Severely lame (LS=3) | 2.3 | -0.5 | 3.3 | -0.7 | 1.9 | -0.3 | 1.4 | -0.3 | 2.7 | -0.4 | 2.6 | -0.3 |
| Lame (LS>1) | 10 | -1.5 | 10.5 | -1.5 | 7.8 | -0.7 | 7.7 | -1.1 | 10.1 | -1 | 9.8 | -0.9 |
| Hock score | ||||||||||||
| No lesions (HS=1) | 73.5 | -4.6 | 89.9 | -1.7 | 93.6 | -1.1 | 93.2 | -1.8 | 81.4 | -2.6 | 82.8 | -2.3 |
| Mild/moderate lesions (HS=2) | 20.7 | -3.5 | 8.3 | -1.4 | 5.3 | -1 | 6.4 | -1.7 | 14.6 | -2.1 | 13.6 | -1.8 |
| Severe lesions (HS=3) | 5.8 | -1.3 | 1.8 | -0.4 | 1.1 | -0.2 | 0.5 | -0.2 | 4 | -0.7 | 3.6 | -0.6 |
| Hock lesions (HS>1) | 26.5 | -4.6 | 10.1 | -1.7 | 6.4 | -1.1 | 6.8 | -1.8 | 18.6 | -2.6 | 17.2 | -2.3 |
| Body condition score | ||||||||||||
| Thin (BCS<2.25) | 9.7 | -3 | 2.8 | -0.6 | 2.3 | -0.4 | 1.8 | -0.4 | 6.5 | -1.7 | 6 | -1.5 |
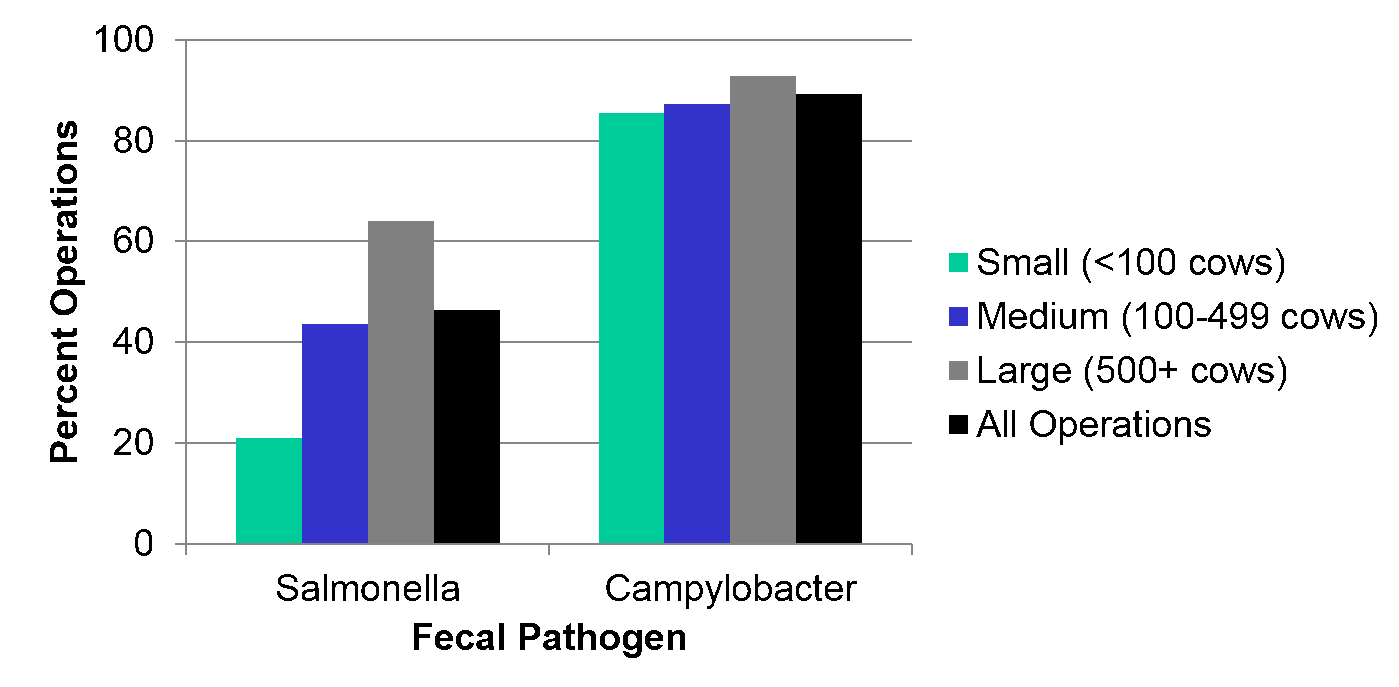
To address the study’s objective of estimating the prevalence of selected foodborne pathogens (Salmonella, Campylobacter), fecal samples were collected from various sites on participating dairies. Percent of various sized farms with at least one positive test for these pathogens are depicted in Figure 4.
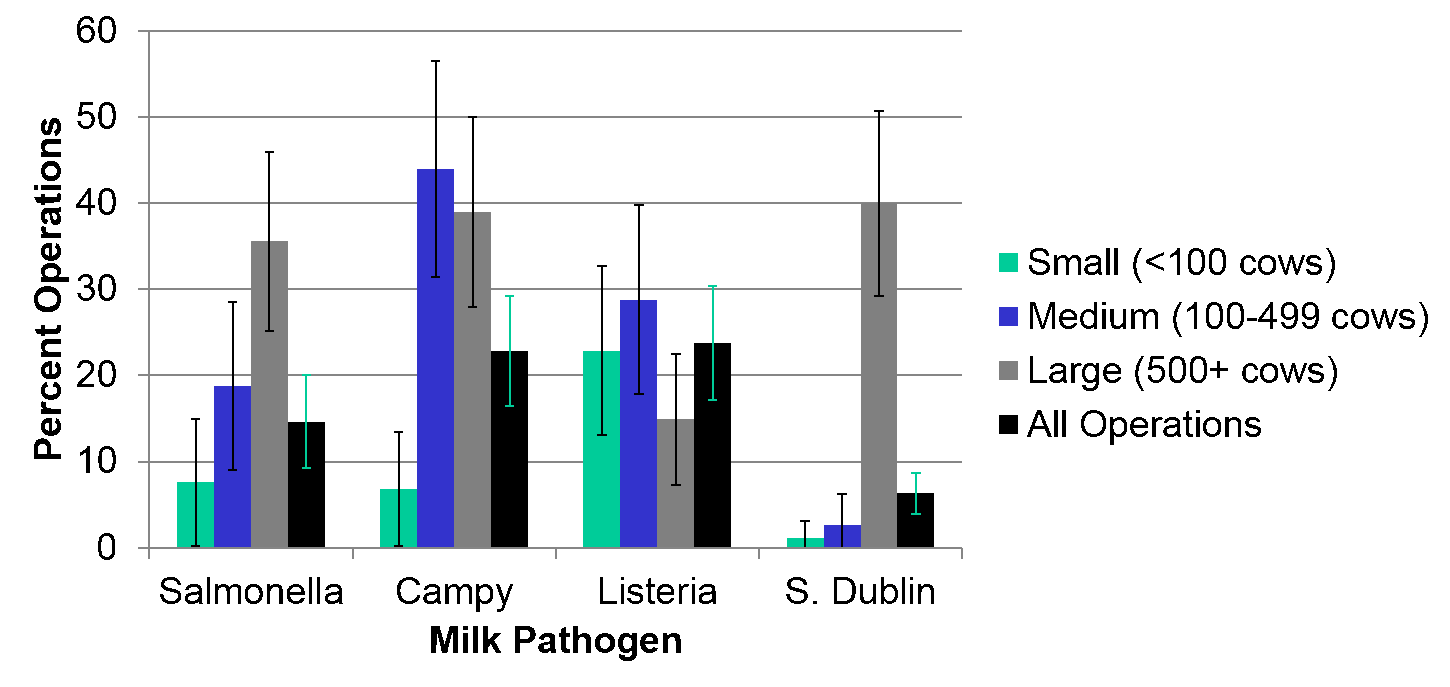
Bulk tank and milk filter samples were collected to estimate the prevalence selected foodborne pathogens (Salmonella, Campylobacter, Listeria, Salmonella dublin). Percent of various sized farms with at least one positive test for these pathogens are depicted in Figure 5.
More results will be shared in future articles. Those interested in complete results from the 2014 Dairy Study can access publications when posted on https://www.aphis.usda.gov/aphis/ourfocus/animalhealth/monitoring-and-surveillance/nahms.
Susan Kerr, Northwest Regional Livestock and Dairy Extension Specialist, kerrs@wsu.eduAmber’s Top Ten Tips: Feeding Forages to Pre-weaned Calves
Did you know that about 50% of dairy producers surveyed in 1992 offered hay to calves within the first 14 days of life? In 2014, only 20-30% of producers reported offering hay to pre-weaned calves and the first offering typically didn’t occur until calves were 30-58 days old. What happened? What caused the dairy industry to reconsider feeding forages to pre-weaned calves? I recently presented a talk in Lynden, WA, on these very topics.
One producer applied the information he/she learned during my talk and began offering hay to calves at seven days of age. Previously, the producer waited to offer hay until calves reached 40 days of age (calves are weaned at 80 days of age on this particular dairy). The results this producer noticed were encouraging and he/she contacted me to share the news. Not only were the calves eating more starter grain than usual, but they were also starting to eat grain at an earlier age. On top of that, calves were consuming more water than usual. We are all curious to see how these calves look a couple of months from now. Will they wean at a heavier weight? Are there long-lasting effects of feeding hay at a younger age? For now, we will just have to wait and see.
I summarized my talk into the ten tips listed below, but you may also access the video of my talk at https://www.youtube.com/watch?v=n9XK8vyAjIM. I hope you find this information to be useful as you contemplate whether feeding forages to your pre-weaned calves would be a good fit for your dairy.
What you need to know about the advantages and disadvantages of feeding forages to pre-weaned calves:
-
Energy and Digestion.
Starches are known to provide more energy per unit and are more quickly digested than forages. This is one reason why starter intake has been preferred over forage intake for pre-weaned calves.
-
Rumen Development.
Another reason starter grains have been preferred over forages is because volatile fatty acids (VFAs) from forages may negatively impact rumen development. A 1962 study found that pre-weaned calves fed hay developed 63-67% fewer papillae in their rumens. The papillae, as we know, play a key role in the absorption of nutrients in the rumen.
-
Appetite.
Consuming forages may lead to “gut fill”, where the forages suppress a calf’s appetite and less starter feed is consumed by the calf.
-
Dry Matter Intake.
The consumption of hay during the pre-weaning period may actually lead to increases in pre-weaning (up to 15% increase) and post-weaning (up to 38% increase) dry matter intake.
-
Body Weight.
Forage feeding in pre-weaned calves has been associated with heavier weaning weights (increases up to 9%), but not all studies support this claim. No differences in body weight have also been documented.
-
Average Daily Gain.
A 36% increase in average daily gain was reported in calves fed alfalfa hay during the pre-weaning period.
-
Feed Efficiency.
Offering forages to pre-weaned calves does not appear to influence feed efficiency.
-
Heart Girth.
Calves fed hay during the pre-weaning period had slightly larger heart girths (a 2% increase).
-
Abdominal Girth.
The addition of hay to pre-weaned calf diets has resulted in larger abdominal girths (a 6% increase).
-
Future Performance.
Few studies have evaluated the long-term effects of feeding forages to pre-weaned calves. Our understanding, thus far, is that this diet does not impact a calf’s future performance (reproductive success or future milk yield).