We have exciting news to share! The Washington State Dairy Federation, University of Washington’s Pacific Northwest Agricultural Safety and Health Center, and WSU’s Dairy Cattle Behavior and Welfare program (Dr Adams Progar) are collaborating to make safety training materials more accessible and effective for dairies. Our project has three parts: 1) develop an online interactive safety training toolkit; 2) offer in-person workshops to teach dairy owners and managers how to use the safety training toolkit materials; and 3) create an interactive train-the-trainer program that focuses on teaching employees how to minimize risks associated with cattle-related injuries.
Dairy Safety Training Toolkit
Where do you look for safety training materials? Do you ever struggle to find materials on a specific safety topic? Our online safety training toolkit will hopefully become your go-to for all dairy-related safety topics. One of the best features of this resource is that you will be able to interact with the toolkit moderators and other toolkit users. This system will allow you to provide instant feedback on how the materials can be improved and allows you to incorporate tips from other toolkit users. We are currently working on developing the toolkit and are looking for beta testers. Please let us know if you are interested in helping us out as a beta tester.
In-person Workshops
We held our first workshop at the Agriculture Safety Day on February 5th, 2019. Our topics included on-farm communication, effectiveness of different employee training methods, and farm-to-farm networking to improve safety training materials. If you have any topic suggestions for next year’s Agriculture Safety Day, please let us know.
Train-the-Trainer Program
Several dairy cattle handling training programs are available to you and your employees. Most programs focus on training your employees to safely move cattle. The Train-the-Trainer program we are developing is focused on injury prevention. Our goal is to identify the most common employee injuries that are cattle-related on dairies and design a training that specifically targets how to minimize the risks associated with those injuries. We will train dairy managers/safety coordinators so that they have the tools they need to provide this training to the employees on their dairies. This safety training will be offered in each region of Washington State later this year, so please stay tuned for more information.
Amber Adams Progar, Dairy Management Specialist, Department of Animal Sciences, Washington State University, amber.adams-progar@wsu.edu
Update on Struvite as a Phosphorus Source for Modern Alfalfa Systems
The WSU Livestock Nutrient Management program has teamed up with WSU’s forage specialist Dr. Steve Norberg, and two Washington alfalfa growers to demonstrate struvite’s performance as a recycled phosphorus source for alfalfa. Struvite (6-29-0), also known as magnesium ammonium phosphate, is a medium-release rate fertilizer that is recovered from liquid manure or wastewater. Ongoing research in eastern Washington with 2 field demonstrations and multiple plot studies confirm the findings of previous studies’ that alfalfa fertilized with Struvite has comparable yields and quality to alfalfa fertilized with MAP (11-52-0). We paid close attention to the first cutting’s response to Struvite to see if its lower solubility affected its ability to meet alfalfa’s early growth requirements.
The field demonstrations were on 60-80 acre fields in Moses Lake and Kittitas where we compared Struvite and a Struvite-MAP mixture (70%-30% of P, respectively) to MAP. Struvite alone was applied before a new seeding of alfalfa on Farm 1, while the Struvite-MAP mixture was surface applied to an established stand on Farm 2. Data was gathered from 2 of 3 cuttings at Farm 1 and 4 cuttings at Farm 2 in the first year. Results showed Struvite produced similar alfalfa yields, phosphorus uptake, and quality as MAP (Table 1).
Table 1. Alfalfa hay yields, P uptake, and relative feed value (RFV) from 2018
*The Relative Feed Value reflects the digestibility and intake potential of feeds, where greater numbers mean better quality.
1
MAP
7.3
2.0
0.28
0.25
181
Struvite
7.3
2.3
0.28
0.24
168
2
MAP
7.5
2.4
0.27
0.26
155
Struvite + MAP
7.1
2.2
0.27
0.28
165
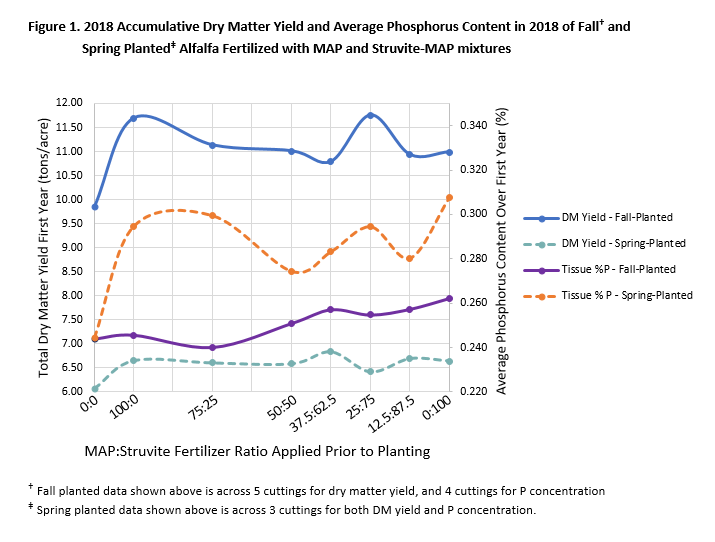
Two simultaneous plot studies (< 1 acre each) were conducted by Dr. Norberg in Prosser to compare agronomic performance of different combinations of Struvite and MAP mixtures on fall and spring planted alfalfa. Plots were randomly fertilized at a constant rate with one of 7 different mixtures of MAP:Struvite (100:0, 75:25, 50:50, 37.5:62.5, 25:75, 12.5: 87.5, 0:100) just before planting, or left as an unfertilized check. The fall-planted alfalfa was cut 5 times in 2018, while spring-planted was only cut 3 times. The source of P, whether MAP or Struvite, did not have a significant effect on yield or P uptake in the first cutting and season-wide, regardless of planting time (Figures 1 and 2).
In short, what we’ve learned so far from the field demonstrations with the supporting data of the plotwork is that Struvite can provide enough P in the first year after fertilization to reach comparable yields and P uptake as MAP. Furthermore, the similarity in the first cutting after a new seeding in both studies has shown Struvite is available to meet the immediate needs for early establishment of alfalfa. This ongoing research will continue for a second harvest season this summer to compare the long-term performance of the two fertilizers.
Figure 1. 2018 Accumulative Dry Matter Yield and Average Phosphorus Content in 2018 of Fall* and Spring** Planted Alfalfa Fertilized with MAP and Struvite-MAP mixtures [*Fall planted data shown above is across 5 cuttings for dry matter yield, and 4 cuttings for P concentration.] [**Spring planted data shown above is across 3 cuttings for both DM yield and P concentration]Figure 2. Dry Matter Yield and Average Phosphorus Content at First Cutting in 2018 of Fall and Spring Planted Alfalfa Fertilized with MAP and Struvite-MAP mixtures.
Erin Mackey, M.S. Graduate Student, Department of Animal Sciences, erin.mackey@wsu.edu
Please join us for WSU Dairy Program Weekend In Pullman. All events will be held in the Ensminger Pavilion, 455 Lincoln Dr.
On Friday January 24 and Saturday the 25 the annual CUDS review will occur with selected industry reviewers.
On Friday night, January 24, the WSU Dairy Club will host their annual Dairy Club Banquet (including a silent auction) from 5:30 – 8:00 PM. Please RSVP to savannah.crnick@wsu.edu for banquet reservations, cash will be accepted at the door.
On Saturday January 25, a CUDS reunion will be held beginning at 3 PM and concluding at 8 PM. Reservations (https://www.brownpapertickets.com/event/3918480) are required for the catered meal.
A block of rooms has been reserved at the Residence Inn (reservation link)
Please direct questions to Joe Harrison.
Joe Harrison, Livestock Nutrient Management Specialist, jhharrison@wsu.edu
Amber’s Top Ten Tips: What We Learned About Pest Birds On Washington Dairies
Winter is the season for colder temperatures, holiday celebrations, and pest bird problems. Dairy barns attract more pest birds during the colder weather because they offer a warm shelter with plentiful food. The influx of pest birds on dairies results in lost feed from bird depredation, feed spoilage, building depreciation, increased costs for bird deterrence, and potentially negative consequences on cow well-being. Our Pest Bird Management Research Team conducted a survey and on-farm study over the last year to gain insight on the “big picture” of pest bird damage on Washington dairies. Here is a list of 10 things we learned:
Number of birds on dairies
During the peak of bird presence on dairies, 51% of surveyed farmers reported that 1,000 – 10,000 birds are present per day.
Birds that cause the most damage
European starlings, pigeons, and sparrows were the top three bird species that farmers identified as causing damage on Eastern Washington dairies. Western Washington dairies reported European starlings, pigeons, and crows were the top three damage-causing birds.
Popular bird deterrence methods
The three most popular bird deterrence methods used by surveyed farmers were shooting, netting, and trapping. However, 88% of the farmers that used shooting for bird deterrence considered the method to only be somewhat effective.
Alternative bird deterrence methods
Approximately 10% of surveyed farmers reported that the presence of predator birds (such as hawks and falcons) or the use of predator calls are alternative methods they use on their dairies to deter birds.
Johne’s disease and Salmonella
Dairies with more than 10,000 birds present per day were more likely to report the presence of Johne’s disease or Salmonella within their herds.
Salmonella, Escherichia coli (E. coli), and Campylobacter in bird feces
We collected fresh bird feces from the feed bunks of 16 pens (five different dairies) across Washington. Samples were analyzed for Salmonella, E. coli, and Campylobacter. Salmonella was not detected in any samples, but about 39% of the samples were positive for E. coli. Only one sample was positive for Campylobacter jejuni, bacteria linked to abortions in cattle.
Cow aggression at the feed bunk
We recorded cow and bird behaviors at the feed bunks of 16 pens (5 different dairies). As the number of birds at the feed bunk increased, cows showed more aggression toward the birds. This means that cows were spending more time displaying aggressive behaviors, interrupting their time spent eating.
Economics of feed loss due to bird depredation
Surveyed farmers reported losing an average of 4.4% of their feed to birds. This adds up to be about $14.7 million/year of losses.
Washington’s gross domestic product (GDP)
Our models predict that feed loss from bird depredation on dairies will result in a loss of 154 jobs and $12.6 million in Washington’s GDP over five years.
Birds deplete nutrients in cattle feed
Our team collected fresh feed samples from 19 pens (5 different dairies) to measure the net energy for lactation, total digestible nutrients, fat, crude fiber, ash, dry matter, and protein content. These samples represented the balanced diet formulated for the cows (what the cows were meant to eat). After the delivery of fresh feed, birds were allowed to eat at the feed bunk uninterrupted while the cows were being milked. After 30 minutes, we collected another sample of the feed from an area where birds had been eating. These samples represented the diet that was available to cows after bird depredation (what the cows actually get to eat). Our most shocking result was that farms lost up to 31% of net energy for lactation. This loss occurred after only 30 minutes of bird depredation!
We sure learned a lot over the last year, but we only scratched the surface of the problem. Our next steps are to test some alternative bird deterrence methods to determine which methods may be more economically feasible and long-lasting. Please contact us if you have any questions or ideas on how we can help dairy farmers manage this problem.
This project is funded by the Western Sustainable Agriculture Research and Education Program (Project # SW16-013). Our Pest Bird Management Research Team includes Stephanie Shwiff (USDA-APHIS), Karen Steensma (Trinity Western University), Susan Kerr (WSU), Julie Elser (USDA-APHIS), Tyler Caskin (WSU), and Amber Adams Progar (WSU).
Amber’s Top Ten Tips: Calf Jackets and Jersey Calves
Across the United States, calf mortality rates are between 5 and 7%. Changes in weather or environmental conditions are associated with an increased risk for calf illnesses. This is why we see more calf illnesses when the seasons change. Jersey calves, in particular, are susceptible to colder weather because of their small body frame. Using calf jackets is one management practice we use to help calves cope with cold weather conditions. Some farmers have witnessed the benefits of calf jackets firsthand, while others are not convinced that jackets are effective. Scientifically, we have only a handful of research studies that measured the effectiveness of calf jackets and the results are conflicting. During the winter of 2017, the Adams Progar Lab at WSU completed a study on a Washington State dairy to measure how the use of calf jackets in Jersey calves impacts calf health, behavior, and growth during the first two weeks of age. Please consider our key findings below when deciding whether providing calf jackets to your calves would be beneficial and economical.
Body temperature
Calves that wore jackets and calves that did not wear jackets had similar body temperatures. Body temperatures averaged 101.28 °F throughout the study. Note: a calf’s body will allocate more energy towards maintaining internal body temperature during cold weather, resulting in less energy available for calf health and growth.
Growth
No difference in growth or average daily gain was found between calves that wore jackets and calves that didn’t wear jackets. Overall, average daily gain from birth to weaning was 1.12 lbs/day, with calves weaning at 129.4 lbs. Note: the American Jersey Cattle Association recommends an average daily gain from birth to first pregnancy of about 1.2 lbs/day.
Behavior
All calves spent an average of 66% of their first two weeks of life lying down, regardless of whether they wore a jacket. Calves that wore jackets were not more active than calves that did not wear jackets. Note: during the first two weeks of life, calves typically spend the majority (50% or more) of their time each day lying down.
Health
Calves that wore jackets and calves that did not wear jackets were similar in the number of treatments they received for illnesses. Calves that wore jackets were not healthier than calves that did not wear jackets. Note: this result matches results from previous studies.
Age and health
Over the course of the study, 98% of health treatments for calf illnesses occurred during when calves were 2 – 3 weeks of age (see Figure 1). Note: diarrhea was the most common symptom documented during this timeframe.
Use of small equipment for on-farm data collection
We used two types of small devices to collect body temperature data and housing conditions data. For body temperature data, we used temperature recording devices (iButton® DS1922L, Maxim, San Jose, CA) and for housing conditions, we used HOBO® data loggers (ONSET U12-012, Bourne, MA). Note: please contact me if you are interested in learning how to use these inexpensive tools on your farm.
Housing conditions (hutches) and the environment
For housing conditions, we used ambient temperature and relative humidity to calculate the temperature-humidity index (THI) within each hutch. As the environment, or outdoor weather, decreased by 1°F, the THI within the hutch decreased by 1.8 units. Note: this study did not consider wind speed. It is interesting to point out that the relationship between the environment and hutch THI is very strong.
Housing conditions (hutches) and lying behavior
As hutch THI decreased by one unit, calf lying behavior increased by about 2%. Note: small changes in lying behavior are not necessarily a bad thing, but if the THI gets low enough, it could greatly affect calf behavior. More lying behavior means calves are not as active, and possibly not eating or drinking as much.
Housing conditions (hutches) and body temperature
As hutch THI decreased by one unit, calf body temperatures decreased by 0.03°F. Note: The fluctuations in hutch THI can vary greatly throughout the day, potentially causing calf body temperatures to also fluctuate. These fluctuations challenge the calf’s immune system.
Calf jacket tips
The evidence of whether calf jackets work is not strong; however, if you have a positive experience with jackets, then I encourage you to continue using them. One thing to keep in mind is to check the jacket for sizing/fitting as the calf grows. It is a simple check that can make a world of difference. Many thanks to the American Jersey Cattle Association for providing monetary support for this project.
Figure 1. Example of the number of health treatments Jersey calves received during the first two weeks of life. The black bars represent calves with jackets and grey bars represent calves without jackets.
Amber Adams Progar, Dairy Management Specialist, amber.adams-progar@wsu.edu
2019 Cooperative Dairy Students (CUDS) Reunion
This year will be the 41st year of the existence of Cooperative University Dairy Students or CUDS. The advisory team would like to invite to a celebration on Saturday January 26, 2019 at the Ensminger Pavilion on the WSU Pullman campus.
We are in the initial planning stages in regard to specific plans and will share more this fall.
Please reply and indicate your interest in attending, and also forward names and e-mail addresses for members that you know so that we can add them to our mailing list.
Thanks.
Joe Harrison, Amber Adams-Progar, and Amber Merk
CUD Advisors
Joe Harrison, Livestock Nutrient Management Specialist, jhharrison@wsu.edu
Dairy Genomics Workshop
ashington State University and the University of Idaho are co-sponsoring a dairy genomics workshop in Prosser, WA on October 10, 2018, at the Walter Clore Wine & Culinary Center from 10 AM to 2:30 PM.
This meeting will bring together faculty from several universities to provide dairy farmers and advisors with the latest on genomic testing and research. More detailed information about the workshop and who to contact for registration (jdalton@uidaho.edu) can be found on the Veterinary Medicine Extension calendar. Lunch will be provided by Zoetis and Neogen.
Dairy Farm Operations Manager, WSU Knott Dairy Center (Pullman, WA)
Would you like to be part of the heritage of producing quality milk for the world renowned Cougar Gold Cheese, and the distinguished Cooperative University Dairy Students (CUDS)?
The Department of Animal Sciences within the College of Agricultural, Human, and Natural Resource Sciences at Washington State University is seeking candidates for a Dairy Farm Operations Manager (Administrative Professional). The Dairy Farm Operations Manager is responsible for the management of the Department of Animal Sciences Dairy teaching and research herd (Knott Dairy Center). Duties include for planning, scheduling, and directing of personnel resources and facilities for the milking cow herd and replacement heifer events (calving, breeding, milking, nutrition and feeding, health care, forage utilization, milk and livestock sales. This position coordinates animal and facility use serves as the central person for communications and organizational issues in coordination of the needs of multiple research, extension, and courses. Additionally, the manager teaches classes and advises students as assigned by the department chair. The Dairy Farm Operations Manager is an important representative of the Department of Animal Sciences, WSU, and the dairy industry. Please see the full position description posting at wsujobs.com for more information and to apply.
WSU is an EO/AA Educator and Employer.
Joe Harrison, Livestock Nutrient Management Specialist, jhharrison@wsu.edu
This year will be the 41st year of the existence of Cooperative University Dairy Students or CUDS. The advisory team would like to invite to a celebration on Saturday January 26, 2019 at the Ensminger Pavilion on the WSU Pullman campus.
We are in the initial planning stages in regard to specific plans and will share more this fall.
Please reply and indicate your interest in attending, and also forward names and e-mail addresses for members that you know so that we can add them to our mailing list.
Thanks.
Joe Harrison, Amber Adams-Progar, and Amber Merk
CUD Advisors
Joe Harrison, Livestock Nutrient Management Specialist, jhharrison@wsu.edu
New Publication Tackles Approaches to Nutrient Recovery from Dairy Manure
Interested in learning more about emerging technologies for separating nutrients from dairy manure? WSU’s Center for Sustaining Agriculture and Natural Resources has a new publication that summarizes the various approaches being explored for nutrient recovery on dairies – and what we know about the current costs and performance that are associated with each strategy. The publication, Approaches to Nutrient Recovery from Dairy Manure, was a long term effort by Craig Frear (formerly of WSU CSANR), Jingwei Ma (a WSU graduate student), and Georgine Yorgey (WSU CSANR). This publication is a companion to The Rationale for Recovery of Phosphorus and Nitrogen from Dairy Manure.
WSU’s Center for Sustaining Agriculture and Natural Resources has worked on various aspects of anaerobic digestion and nutrient recovery for a number of years. Please visit our Anaerobic Digestion topic page for additional publications, videos, and resources, including links to our Anaerobic Digestion Systems Extension Publication Series.
Georgine Yorgey, Associate Director, Center for Sustaining Agriculture and Natural Resources, yorgey@wsu.edu
Hoof Care: Beware Too Much of a Good Thing
Hoard’s Dairyman hosted a webinar called “Supervise Hoof Health with a No Lameness Tolerance Policy” on June 11, 2018. The presenter was Karl Burgi, professor emeritus at the University of Wisconsin-Madison School of Veterinary Medicine and Program Director at the Dairyland Hoof Care Institute, Inc. This article will be a synopsis of the portion of that webinar related to hoof trimming; readers are encouraged to view the entire archived webinar at https://hoards.com/article-23342-supervise-hoof-health-with-a-&lsquono-lameness-tolerance-policy.html. Photos used here are from that webinar and used with permission.
Rates of lameness in cows producing over 90# milk/day on U.S. dairies ranges from 13.2 to 54.8%, with a mean of 25%. This huge variation is due to differences in management and factors affecting cow comfort on different farms, of course, but also attitudes about lameness. Some managers react to individual lameness cases; others recognize the effects of lameness on production and animal comfort and devote resources to prevention measures.
A 2017 study calculated the per-case cost of lameness at $527 per cow, which also includes pro-rated death and culling losses. A study of digital dermatitis (DD, a.k.a. hairy heel warts) in heifers revealed affected animals averaged 750 fewer pounds of milk over their first lactation and were open 28 more days than unaffected heifers. Lameness is also responsible for a 20% increase in premature culling and 2% death rate.
Lameness in early lactation is particularly costly because it affects peak lactation and lactation curves. Plus, if a cow becomes lame, the risk of recurrence is increased in subsequent lactations. This is because lameness and its predisposing factors can cause permanent changes to the skin, fat pad, ligaments, and bones of the foot. Therefore, a lameness management program should emphasize prevention for greatest success.
Lameness can be assessed on dairies by hoof lesion scores, locomotion scores (3-, 4-, and 5-point scale systems are available), management software, and/or hoof health analysis. The main foot lesions are DD, sole ulcers, white line disease, thin soles/toe ulcers, and foot rot. If DD is reduced, all other types of lesions will be reduced as well. The presentation includes recommendations for DD treatment and control not discussed here.
There are two types of hoof trimming: functional (routine to deal with hoof growth and maintain proper weight-bearing angles and surfaces) and therapeutic (treatment of issues causing lameness). Mr. Burgi states when it comes to functional trimming, “less is more” but “more is better” for therapeutic trimming. Ironically, hoof trimming may be a causative lameness factor if lameness cases persist in spite of addressing the following issues successfully:
Cows are handled properly by crowd gates and humans (i.e., not rushed).
Cow comfort is addressed and cows spend at least 12 hours lying down daily.
Effective hoof baths are installed, used, and maintained properly (see webinar).
Cows have secure footing on floors.
Heat abatement measures are taken when needed to encourage lying time.
Cows spend less than 2.5 hours/day out of pens (3× milking).
For each animal, assess the need for hoof trimming 3 to 8 weeks pre-calving and 1 to 3 times during lactation, or more often depending on the environment and an animal’s history. Routinely check first-calf heifers by 4 months into lactation. Note problem animals requiring more frequent monitoring in a computer management or other record-keeping system.
Pastured springing heifers should be brought in from pasture about 2 months before calving to give them time to develop protective fat pads in their feet and adjust to concrete. Their feet should be examined and trimmed at this time. Springing heifers stand significantly more time than cows. Standing on overgrown or improperly trimmed hooves will result in inflammation, which can predispose heifers to sole ulcers and a shortened productive life. Inflammation appears as redness in the sole (Photos 1 and 4); redness also means there is no overlying protective sole in that area.
Hoof trimming should not cause lameness, reduce cow welfare, or prevent lame cows recovering from their initial problem. Hoof trimming mistakes include:
Trimming hooves too short. Normal claws should be 3” long with about ¼” sole thickness.
Over-trimming heels, which changes (lowers) the angle where toes meet the ground (Photo 1); sole ulcers and white line disease can result.
Grinding or otherwise over-trimming claw walls (Photo 2). The wall is weight bearing; grinding removes the wall and permanent P3 (coffin bone) remodeling and loss will follow. Never remove the wall unless the animal is lame and the wall is involved—in such a case, apply a hoof block after trimming.
The sole is ground down excessively (Photos 3 and 4). Less than ¼” sole thickness causes inflammation resulting in sole ulcers and lameness. Soles can be ground away during excessive hoof trimming or by harmful environmental conditions (coarse sand, poor grooving, and exposed cement aggregate).
Leaving claws unbalanced.
Sole is not left flat.
Photo 1. Left photo shows over-trimmed heels causing undesirable low angle at toe, which changed the angle of weight bearing (dashed black line). Right photo shows targeted trimming preserving heel depth, which maintained proper toe angle. This resulted in good weight bearing through the entire foot bone structure with even weight distribution throughout the claw. Note how sole was pared away on right claw to remove weight-bearing surface over an inflamed area (yellow arrow) so this area can heal, similar to applying a block to the good claw. The green arrow and line denote where pressure is born on the sole: concentrated on the left photo due to low toe angle, which predisposes to sole ulcer and lameness; well distributed over the entire sole on the right.Photo 2. A “pretty hoof” post-trimming, but excessive wall was needlessly ground away, reducing the proper and normal weight-bearing tissue for this animal.Photo 3. Another “pretty foot” post-trimming where too much emphasis was placed on making a level weight-bearing surface. Note results of excessive grinding: so much protective sole has been removed that blood was drawn at toe; in that area, human interference has remove all the sole. A toe ulcer and lameness will follow. Weight-bearing wall tissue was also ground away needlessly.
Inflammation occurs before lameness. Some factors increasing the risk of inflammation include:
Calving—stressful time for all cows and heifers; any pre-calving foot issues are exacerbated after calving
Excessive standing—reduces hoof circulation, which affects hoof health; secondary to overcrowding, too much time in head catches or holding pens, heat stress, or uncomfortable beds
Delayed treatment—lets DD become chronic, facilitates secondary ulcers and foot rot
Lack of trimming—causes trauma from abnormal forces on hoof structures
Lack of blocking of ulcers—affected tissues do not have time to heal and inflammation continues. Blocks take pressure off painful tissues and increase oxygen contact with hoof tissues, which can kill some hoof disease bacteria.
Hoof inflammation can be prevented or reduced by providing an adequate number of comfortable stalls; using heat abatement measures to keep cows comfortable while lying; investigating all lameness cases within 24 hours; and using anti-inflammatory medications based on veterinary recommendations. Also, hooves should be trimmed 3 to 8 weeks before calving so all close-up animals have proper hoof anatomy and function. Close-up and fresh cows should have excellent cow comfort, including no overcrowding. Lameness in close-up, calving, and fresh animals should be avoided at all costs due to the major negative effects on milk production and animal welfare.
Photo 4. Toe ulcers secondary to thin soles. Thin soles are caused by over-trimming (especially grinding), rough floors, coarse sand, and too much time standing.
Due to their associated costs, long-term implications, and effects on animal well-being, lameness cases need to be investigated and addressed promptly. Few conditions causing lameness improve on their own and many can progress to career-ending ulcers, abscesses, or bone/joint infections in otherwise productive cows. Having a well-defined lameness program with designated trained people responsible for lameness detection and prompt treatment is essential, as is a record-keeping system to flag and record actions.
Free educational material is available from Zinpro through an online request at https://www.zinpro.com/contact-us/dairy-materials-request. They have Dairy Claw Lesion Identification and Locomotion Scoring charts in English and Spanish.
Susan Kerr, WSU Northwest Regional Livestock and Dairy Extension Specialist, kerrs@wsu.edu
Your Voice Should be Heard: Dairy Worker Safety Survey
What are your thoughts on dairy worker safety? As you may already know, employee injuries on Washington dairy farms are often related to cattle handling or slips, trips, and falls. These injuries are often preventable. In addition to reducing the rate of injury occurrences, effective safety training programs can help reduce costs to you as an employer.
On behalf of the WSU Animal Sciences/Extension program and the Pacific Northwest Agricultural Safety and Health (PNASH) center, we are asking for your help in completing a 10-minute survey on worker safety practices. Questions included will pertain to the current safety practices and training needs of your farm. Focusing on dairies in the Pacific Northwest, our goals include identifying and understanding what dairy owners like yourself want and need to promote safety on your farm. With the information provided to us in this survey, our partnership can do a better job of providing services and research that directly benefit dairy owners and their employees. Please visit the survey at https://is.gd/dairy_survey.
Feel free to contact us with any questions or concerns.
Livestock producers such as dairy farmers feed their animals complex rations, usually on a least-cost nutrient basis. This means they meet animals’ nutritional requirements using the most cost-efficient feeds they can obtain. This addresses two aspects of farm sustainability: animal welfare (meeting animals’ nutritional needs) and financial success (reducing expenses to increase profitability). Livestock nutritionists are constantly adjusting the rations their clients feed based on the cost and availability of ingredients; farmers make recommended ration changes gradually to not upset critical populations of intestinal digestive microbes.
Table 1. Comparison of chemical analysis results: 2017 pea variety trial and canola meal values.
(1) TDN = total digestible nutrients; an overall measure of energy contained in a feedstuff. (2) LCP = crude protein. (3) NDF = neutral detergent fiber; low number desirable and associated with greater feed intake by livestock. (4) ADF = acid detergent fiber; low number desirable and associated with higher feed (fiber) digestibility. (5) Provided for comparison to peas. Nutritional content depends on process used to extract oil. Sources: Neibergs et al., 2016 and Canola Council of Canada, 2015.
Dry peas (a.k.a. field peas, Photo 1) are a cool season annual crop well suited to northwestern WA. They can be seeded directly into previous crop residue in mid-March to mid-May or whenever soil temperature is over 40°F (O’Neal, 2017). Cold-tolerant varieties can be planted in the fall as a cover crop or to produce dry peas for livestock or humans. In areas with dry summers, fall planting can result in higher yields due to earlier spring growth, earlier bloom, and earlier harvest; there will be more nitrogen fixation, as well (O’Neal, 2017).
In Washington State, 90,000 acres of dry edible peas were planted in 2016. They yielded an average of $12.30/cwt, and were valued at $317 per harvested acre (Mertz, 2017).
Photo 1. Dry peas immediately after harvest and shelling.
Benefits of Peas
Peas have the potential to be a beneficial rotational crop for many reasons:
They are an alternative to summer fallow and another option for crop rotation
Peas can be inter-seeded with corn, oats, barley, or other crops to boost protein content of hay and haylage
They are a legume and will fix atmospheric nitrogen to improve soil fertility
Peas have a taproot that can help reduce soil compaction and improve water and nutrient movement
They can mature by mid-August so a fall crop or cover crop can still be planted
Peas can be combined to save harvesting labor; equipment is available locally
Post-harvest aftermath can be baled, tilled in, or grazed
The low moisture of dry peas facilitates long-term storage as a feed commodity
Are Peas the Answer?
Hoping for a high-protein feedstuff they could grow locally for more control over price and availability, dairy producers in northwestern WA wondered about the suitability of dry peas. Peas were grown in northwestern WA for decades until local processing ceased around 2010. Nevertheless, pea planting and harvesting equipment is still available in the area, as are growers with experience in and historical knowledge of pea production. Could these resources support a mini-resurgence of the northwestern WA pea industry as a source of high protein livestock feed?
WSU-NWREC 2017 Pea Variety Trial
Faculty at the WSU-Northwestern Research and Extension Center (NWREC) conducted a dry (grain) pea variety trial in 2017 with three pea varieties and one bean variety. Funding was provide by the Northwest Agricultural Research Foundation ($2,037). Seed was provided by John De Vlieger (Fava and Dundee varieties), Skagit Farmers Supply (Flex), and Albert Lea Seed (Admiral). Pre-planting and post-harvest soil data is available for those interested. Pre-emergent herbicides treflon (1 pint/acre) and dual magnum (1.5 pint/acre) were incorporated pre-planting. Fertilization was 18 lbs of nitrogen per acre and 60 lbs of phosphorus per acre at the time of planting. Production data are presented in Table 2; chemical analysis by variety is contained in Table 1.
Table 2. WSU-NWREC 2017 pea variety test plot details.
Variety
Planting rate
Planting date
Harvest date
Precipitation over growing season
Production (tons/acre)
Admiral
200 lbs/acre
05/10/2017
08/18/2017
2.45”
2.5
Dundee
200 lbs/acre
05/10/2017
08/18/2017
2.45”
1.5
Flex
200 lbs/acre
05/10/2017
08/25/2017
2.45”
1.9
Fava
180 lbs/acre
05/10/2017
09/15/2017
2.73”
2.4
Growing Season Observations and Comments
All seed varieties emerged and grew well. They thrived in the 2.9% organic matter, 6.8 pH soil with less than 3” of rainfall throughout the growth period. Chemical analysis content provided in Table 1 shows all pea varieties compared favorably with canola meal with respect to energy content, crude protein, and fiber digestibility.
Black aphids attacked the fava beans, but it was unknown if this affected productivity. The major challenge, however, was Canada geese: they moved through the fields in an orderly fashion from east to west, devouring all peas they encountered. Fortunately, data could be collected from the western side of each plot because these areas had not yet experienced any goose damage (Photo 2). Fava beans matured later than peas. The literature suggests pea production may be improved by planting a mixture of varieties; that was not done in this trial.
Conclusions
With their high protein content and positive environmental effects, peas are once again a crop worth considering for northwestern WA, this time as a locally-produced livestock feed. To increase the likelihood of success, growers will need to conduct soil tests and probably raise soil pH (peas do not perform well in acidic soils) and have a plan to mitigate effects of grazing geese. Additional studies of how grain peas could contribute to high-value crop disease control, soil quality, nutrient cycling, reduction of livestock feed costs, and a myriad of other factors would be excellent candidates for SARE on-farm research project funding.
Photo 2. WSU-NWREC field pea trial, Aug. 17, 2017.
Amber’s Top Ten Tips: Considerations for Bucket Feeding Pre-weaned Calves
Is it better to offer milk/milk replacer in buckets or bottles for preweaned calves? This is a common debate within the dairy industry. Feeding milk in bottles allows calves to exhibit suckling behavior, which minimizes the occurrences of non-nutritive sucking behavior. Buckets are easier to clean and sanitize, which minimizes calf exposure to potentially harmful pathogens. We understand the obvious advantages and disadvantages of both feeding systems; however, we often overlook an important aspect, labor. Drinking out of buckets is not intuitive for calves so additional labor is needed to train them. How long does it take to train calves to drink from buckets? Well, that is exactly what researchers at Washington State University wanted to determine. Cameron Mandel, Amber Adams Progar, Bill Sischo, and Dale Moore recently published a study in the Journal of Dairy Science that monitored 1,235 bucket-fed calves. Below I will highlight some important results from this study. Please consider these results if your dairy uses, or is contemplating switching to a bucket feeding system:
Use of a bucket vs. bottle feeding
According to the USDA National Animal Health Monitoring System, dairies in the United States fed milk or milk replacer to 59% of preweaned heifer dairy calves using buckets, with 38% more calves in the East than the West fed with buckets. In comparison, a study concluded that about 92% of dairy farms in Quebec fed heifers with buckets.
Heifer vs. bull
After 3 days of age, heifer calves were 1.5 times less likely to require assistance compared with bull calves.
Twins
Twins had almost twice the odds of requiring assistance after 3 days of age than singletons.
Calf position at birth
A calf born facing forward was less likely to require assistance with drinking after 3 days of age, when compared to a calf born backwards. Sixteen percent more of the calves born backwards needed assistance drinking than calves born forwards.
Dam
About 4% more calves born to heifers tended to require assistance longer than calves born to cows.
Calving score
The level of difficulty during calving (calving score) did not appear to affect the amount of time a calf required for training. Calving score was assigned as a 1 (normal delivery), 2 (some assistance), or 3 (difficult birth).
Average training requirement
The average time required for training was 3.4 days. After 3 days of age, almost 60% of calves consumed the entire morning milk allotment without assistance.
Time of year
Calves were enrolled onto the study between the beginning of May and the end of July. A calf born after June 8th was 2-5 times less likely to need assistance after 3 days of age than calves born during the first week of the study.
Calf behavior – depressed vs. alert
Depressed (slow to respond to the environment) calves were four times more likely to be assisted than alert calves.
Calf behavior – sternal vs. standing
Alert, sternal (lying down) calves were 2.4 times more likely to require assistance than alert, standing calves.
Article citation: Mandel, C., A. Adams-Progar, W. M. Sischo, and D. A. Moore. 2017. Short communication: Predictors of time to dairy calf bucket training. Journal of Dairy Science 100:9769-9774.
How long does it take to train a dairy calf to drink milk from a bucket?
Amber Adams Progar, Dairy Management Specialist, amber.adams-progar@wsu.edu
Cooperative University Dairy Students Annual Industry Review (January 25 – 26, 2018) & Dairy Club Banquet (January 25, 2018)
The Cooperative University Dairy Students are busy working on projects and preparing for the annual CUDS Review. Recently, CUDS recruited new members, and starting in January 2018, there will be 12 new members. CUDS has recently installed an inline sampler so they measure their components. Currently, the CUDS herd is producing an average of 82.5bs/head/day with 47,000 SCC, 3.38% milk protein, and 4.36% butterfat.
Every year a panel of invited reviewers consisting of industry professionals from Washington, travel to Pullman to hear presentations from CUDS members. Each student in CUDS develops goals and projects for their chair position (nutrition, herd health, finances, etc.) and works towards accomplishing these throughout the year. The annual CUDS Review will be held January 25-26, 2018 this year.
On Thursday night, January 25, the WSU’s Dairy Club will be hosting a banquet as a way to fundraise for the club. Social hour begins at 6:00 and dinner begins at 6:30. A note from the club’s event chair:
“WSU Dairy Club is a student-led organization that encourages its members to participate in leadership and community outreach projects. The club is centered on educating the community, as well as providing educational opportunities for our members to learn more about the dairy industry. A few of our main events of the year include various guest speakers, Dairy Olympics, American Dairy Science Association regional and national meetings, and Cougar Youth Weekend.
We invite you and your colleagues to join us for good food and good fun. Tickets are available for $15 at the door or $10 if you RSVP in advance. Drink tickets for alcoholic beverages can be purchased for an additional $5. Please RVSP by emailing Chris Mandella (chris.mandella@wsu.edu).”
Grateful for Dairy Manure Derived Struvite in Our Stockings this Holiday Season
The mobile cone unit moved from Snohomish County to Whatcom County this month to continue to remove phosphorus from manure in the form of Struvite. The mobile nutrient removal technology also stirred some interest while sitting outside the Yakima Convention Center at the annual dairy meeting a few weeks ago (pictures below).
We are planning field days on the eastern and western sides of the state to get an up close look at the nutrient removal system. Stay tuned for announcement of those dates. Also, if you are interested in being a collaborator farm by having this technology demonstrated at your farm, please fill out this WSU short info form, or email / call Liz Whitefield (e.whitefield@wsu.edu, 253-445-4562).
Happiest of holidays to you and your loved ones this season from the WSU Livestock Nutrient Management Program.
Mobile Struvite System outside of the 2017 Washington State Dairy Meeting at the Yakima Convention Center.
A view of the cone being cleaned out after a run in Snohomish County.
WSU Livestock Nutrient Manager Director, Dr. Joe Harrison excited for the first filling
of manure in the 5,000 gallon pre-treatment tank.
Liz Whitefield, WSU Livestock Nutrient Management Program Project Manager, e.whitefield@wsu.edu
Western Washington and Oregon Pasture Management Calendar Debuts
A new Extension publication, “The Western Oregon and Washington Pasture Calendar (PMW699),” was created to provide pasture managers and their advisors with a scientific basis for pasture management decisions and the timing of critical actions. A team of Extension educators and NRCS staff recently conducted a series of train-the-trainer workshops throughout western Oregon and Washington to teach fellow professionals and livestock managers how to use this new educational tool. Publication of the Calendar and support for the workshop series were provided by a western regional USDA Sustainable Agriculture Research and Education grant.
Pasture Calendar Contents
The Pasture Calendar starts with the basics: grass terminology, factors controlling perennial forage growth, and plant growth cycles. Maps of Forage Management Zones are included (Fig. 1).
Figure 1. Map Western Washington of Forage Management Zones.
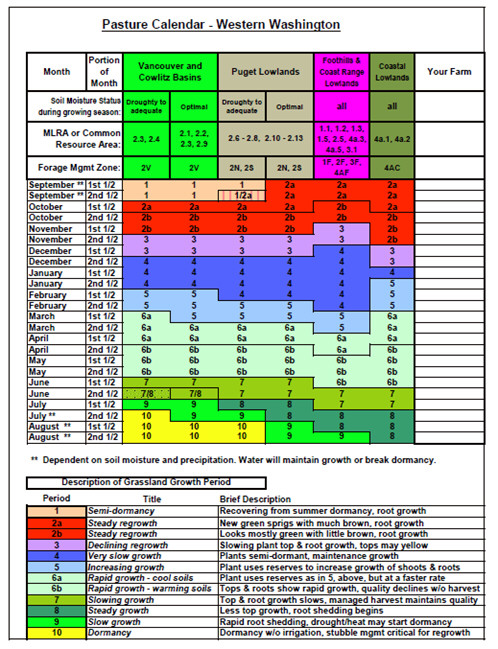
The western Oregon and Washington calendars are divided into 24 management periods consisting of the first and second half of each month (Fig. 2). For each management zone or resource area, a color-coded table indicates what typically happens with grasses during a certain period. These plant growth periods include:
Semi-dormancy
Steady regrowth
Declining regrowth
Very slow growth
Increasing growth
Rapid growth—cool soils
Rapid growth—warming soils
Slowing growth
Steady growth
Slow growth
Dormancy
Figure 2. Western Washington Pasture Calendar with descriptions of grass growth periods.
The Pasture Calendar includes extensive appendices and references. Appendices are:
How Pasture Plants Grow
Pasture Clipping
Sacrifice Areas
Buffer Strips
Irrigation
Laminitis
The Nitrogen Cycle
Nitrates in Forages
Nutrient Excesses/Deficiencies
Alternative Forage Crops
Endophyte Toxins in Forage
Calendar Highlights
The Pasture Calendar emphasizes and explains critical pasture management practices, such as:
Performing soil tests and addressing fertility issues
Selecting a forage species and variety well suited to local growing conditions
Leaving at least three inches of grass stubble at all times
Rotating pastures to let them rest and regrow to grazing height (> eight inches) before regrazing
Grazing or mowing grasses to keep them in vegetative phase and vigorous
Monitoring livestock body condition
Establishing sacrifice areas for livestock confinement during critical periods.
Fall Is All!
The vital importance of fall pasture management is stressed throughout the Pasture Calendar. In early fall (typically September), grass plants generate new roots to replace the ones shed during the “summer slump.” It takes energy for plants to generate these roots, and roots in turn are needed for plants to obtain water and nutrients from soil. Most importantly, next season’s growing points are being established—overgrazing during this period will cause delayed and reduced pasture growth the following spring.
Protect the Lower 3”
Grasses store their sugar for regrowth in the lowest three inches of above-ground growth, not in their roots as previously believed. This means anytime pasture grasses or grass hayfields are grazed or mowed to less than three inches tall, the plants lose their energy reserves and regrowth will be delayed by up to six weeks (Fig. 3). If this mismanagement occurs month after month, plant vigor is affected and desirable pasture plants die; bare soil and weed incursions result. Expensive pasture renovation is then needed but will be pointless unless pasture management practices are changed.
Figure 3. Dr. Steve Fransen demonstrating root health of simulated healthy fall pasture grass (lower hand) vs. simulated overgrazed pasture (upper hand).
Sacrifice Areas Save Plants
Anytime livestock have the potential to graze pastures below three inches, they should be removed from pastures, confined to a sacrifice area, and fed stored forage such as hay or haylage. The need for a sacrifice area could arise during muddy winter months, the pasture summer slump, or if there is not enough pasture for the livestock under management. Conservation District funding may be available to help develop sacrifice areas, which also help protect soil and water quality.
Where to Get the Pasture Calendar
This 50-page, full color publication will soon be available for free downloading at http://pubs.wsu.edu (search for PNW699).
Susan Kerr, WSU NW Regional Livestock and Dairy Extension Specialist, kerrs@wsu.edu
Amber’s Top Ten Tips: Understanding Dairy Cattle Welfare from an International Perspective
What is animal welfare? This is a question I commonly receive from students, farmers, fellow scientists, and the general public. It is this question that sparked much discussion at the 7th International Conference on the Assessment of Animal Welfare at Farm and Group Level earlier this month in Ede, Netherlands. As an attendee and presenter at this conference, I chose to participate in a workshop focused on defining animal welfare. My intent was to finally have a definition of animal welfare that was mutually-agreed-upon by an international group of scientists, government officials, and non-governmental organizations. However, the outcome of the workshop was not what I expected. The take-home message was that everyone views animal welfare differently; therefore, we were not able to agree on a single definition of animal welfare. Although frustrating, it was important for me to hear this message and push myself to better understand the diverse perspectives people bring to the table when discussing animal welfare.
I would like to share these insights with you. Conference attendees that focused on dairy cattle welfare were asked to create a list of the top three current welfare concerns within the dairy industry and then create a list of the top three potential solutions to these concerns. If you were asked this question, how would you answer? The group identified the top three dairy cattle welfare concerns as: 1) cow-calf separation; 2) cow transition period; and 3) transportation. Do you agree? Here are the group’s top suggestions on how to potentially solve these concerns:
Cow-calf separation. Part-time nursing from the cow
This solution would allow calves to nurse from the cow only during specific times of the day. For example, calves could be separated from the cows during the day and then allowed to nurse at night. Another method would be to house the calves and cows together, but offer a separate area that is only accessible to calves. Could this work? Some European countries allow calves to nurse from cows during the first couple months of life. Average daily gains for these calves are impressive at 1.98 – 3.09 lbs/day.
Cow-calf separation. Educational system for farmers to exchange experiences
By offering more opportunities for farmers to build educational networks, would ideas be shared and improved? Educational systems like this have been successful in other industries and areas of the world (cotton in Tanzania and rice in Uganda). Sheep and beef farmers in New Zealand viewed the information exchange between farmers as vital to their success.
Cow-calf separation. Timing of cow-calf separation
Should calves be separated from their dams earlier or later? A survey revealed that 55.1% of US respondents and 68.7% of German respondents favored later separation (days or weeks after birth) over early separation (within first few hours of birth). How to then wean and separate the calves without causing additional distress is still a concern.
Transition period. Social stability during the transition period
Providing adaptable housing systems for transition cows could decrease the number of times transition cows need to be regrouped. As seen on Canadian farms, every time a regrouping occurs, cow feeding time decreases (15 minutes less on the day of regrouping), lying time decreases (3 hours less the day after regrouping), and 2.5 times more displacements occur at the feedbunk.
Transition period. Tools for the early detection of disease
The ability to detect or predict the onset of disease in transition cows would help farmers provide treatments earlier. Researchers in Denmark used the GEA® CowView Real-Time-Location-System to monitor cow behavioral patterns and found that a change in behavior (15% or higher) is an indicator of a change in a cow’s health status. Some heat detection technologies already provide behavior data that can be used to identify changes in cow health.
Transition period. Cow management
Would managing cows to maintain a consistent body condition score throughout the transition period decrease the incidences of disease during this period? Could a shorter dry period or no dry period be considered? A study conducted in the Netherlands noticed that cows provided with no dry period produced about 8 lbs/day less than cows provided with a short dry period (30 days); however, the cows with no dry period had 87% less severe negative energy balance four weeks after calving.
Transportation. Improve truck design and driver training
The transportation of calves, in particular, was discussed as a concern. In Australia, calves transported in trucks with straw bedding had 10% lower creatine kinase activity (an indicator or physical stress and/or muscle damage) than calves transported with solid steel or steel mesh flooring. Other ideas mentioned were: 1) providing additional handling training for truck drivers; 2) installing equipment to control the climate inside the truck; and 3) installing monitoring systems inside the trucks.
Transportation. Mobile slaughterhouse
This suggestion is straightforward. Designing a mobile slaughterhouse would eliminate the need to transport cattle to the slaughterhouse, thus eliminating some of the welfare concerns surrounding cattle transportation. It should be noted, though, that this concept could be very difficult to control from a biosecurity standpoint.
Transportation. Determination of a cow’s fitness for transportation
How would you measure a cow’s fitness for transportation? This is exactly the question Irish veterinarians face when they must decide whether a cow qualifies for a casualty slaughter. Currently, little scientific information is available to help farmers and veterinarians make these very difficult decisions, so we must rely on our best judgment. Perhaps this is an area that requires more attention from scientists?
Anthropomorphism
Although not a solution to welfare concerns, we, as an industry, need to be selective in the words we choose to describe animals. Anthropomorphism is the attribution of human-specific characteristics to nonhuman animals, and occurs commonly in the dairy industry. Participants at the animal welfare workshop were given a situation, had to determine whether it was an animal welfare issue, and provide a reason for the decision. The situation: a cow can’t get pregnant. Is this an animal welfare issue? Why? This may seem like a simple example for you, but the group was divided in half. Some members of the half that said it was an animal welfare issue used the rationale that if a human female found out that she could not get pregnant, then she would be distressed and her welfare would be compromised. This is anthropomorphism. No evidence exists to support the claim that this particular situation is an animal welfare concern. This situation could become an animal welfare concern if, for example, it was known that the cow was experiencing pain.
What are your thoughts on the potential solutions discussed above? Do you agree or disagree with the top three dairy cattle welfare concerns identified by the group? I would enjoy hearing your opinion on these topics. Hope to hear from you soon!
The decreasing supply of domestic phosphate fertilizers virtually guarantees that the disruptive price spikes that have embattled agricultural operations over the past decade will become even more frequent. The cost of phosphorus has climbed nearly back to its historic high of 2008, and its price has outpaced that of farm commodity prices nearly two to one in recent years.
At current rates of extraction, the US will completely deplete its phosphate reserves within 30 years, while worldwide demand continues to increase. The shrinking availability of this essential nutrient presents an unprecedented challenge for agricultural producers, and within only a couple of decades the impacts on farm output, food prices, and global security will likely be severe. Competitive advantages will accrue to growers who adopt systems for more efficiently using and recycling phosphorus, reducing their vulnerability to volatile fertilizer markets.
Washington State University is leading the way toward development and adoption of a recycled, locally available phosphate fertilizer that promises Washington hay growers a more economical, reliable nutrient source in future years. Struvite, or magnesium mono-ammonium phosphate, is produced from dairy manure and wastewater treatment facilities in the form of a precipitated crystal. It is nutrient-dense (6-29-0), odorless, lightweight, and totally unlike the biosolids more typically exported from these sources. Extracted from clarified liquid in mineral form, struvite contains no cellulosic material and absorbs no water. Currently its most common use is on commercial golf courses, testifying to its ease of use and minimal environmental foot print.
Struvite dissolves slowly in the soil, releasing nutrients at almost exactly the rate plants need, which reduces the volume of phosphorus that gets lost to erosion and leaching. Agronomists predict struvite may significantly reduce the rate at which farmers apply phosphate to fields, a further environmental and economic benefit of this recycled nutrient. And struvite’s salt index and heavy metal content are significantly lower than all other commercial NPK fertilizers.
The WSU Mobile Nutrient Recovery Project is conducting onsite demonstrations of a technology that extracts phosphorus at Washington dairy operations and produces struvite, which can then be economically shipped to hayfields within the area. Essentially, the process recovers phosphorus where it is in excess, creating threats to local water systems, and makes it available where it is needed in the wider agricultural region.
WSU is supporting this initiative with field plot studies and greenhouse trials that provide growers an ever-growing body of data on how struvite performs in different soil types and with various crops. . Struvite fertilizer applications have been applied to two commercial alfalfa operations in Moses Lake and Kittitas to date. WSU Livestock Nutrient Management Program is currently working with commercial growers to understand better how it is best applied and how to maximize the advantage of its slow-release characteristic.
Kevin Fullerton, Scientific Assistant, WSU Puyallup
Cow Comfort: How Do Your Cows Spend Their Time?
This article is a synopsis of an excellent research summary paper called “Economic Benefits of Improved Cow Comfort” by Dr. Rick Grant of the Miner Agricultural Research Institute. The entire paper (pdf) is available at dairychallenge.org.
We all realize that for cows to be able to produce milk up to their genetic potential, we need to maximize their dry matter intake (DMI). But did you know we also have to do all we can to help them maximize the time they spend lying down? Lying (resting) time is strongly correlated with milk production, herd longevity, feet/leg health, and DMI. Why? It’s all about rumination.
Resting Associated with Rumen Health
Rumination decreases food particle size and increases the surface area exposed to digestive enzymes; this increases the rate and efficiency of food digestion and transit time. The faster food moves out of the rumen, the sooner there is room for more food to come in. More food coming in more quickly means more milk. Rumination also causes self-buffering of rumen pH through natural bicarbonate in cows’ saliva; more chewing means more saliva and more buffering. Any factor that reduces rumination–lack of effective fiber, stressful environment, lack of resting time, overcrowding, too much time in holding area, too much walking distance, illness, estrus, etc.–can result in rumen acidosis, reduced milk production, reduced milk components, more lameness, and more culling.
Cows Have Daily Time Budgets
Dairy cattle have a daily time budget correlated with optimal health and production (Figure 1). Keeping “time outside the pen” to a minimum is critical because cows will forfeit feeding time to make up for lost resting time. Research has documented that for every three minutes of resting time lost, cows will sacrifice one minute of feeding time. Lack of adequate resting time can cause a five pound drop in milk production the following day. Correspondingly, one additional hour of resting is correlated with two to four more pounds of milk. This concern for adequate resting time is part of a new focus in dairy management called Cow Comfort Economics.
Figure 1. Typical Cow Time Budget, hours/day
(1) Also referred to as “time outside the pen,” which includes anything taking time away from eating, drinking, or resting (milking, walking to milking, time in holding areas, hooftrimming, headlocks for vet checks or breeding, etc.)
“…the cow only has, on average, 2.5 to 3.5 hours per day to spend outside the pen and away from the feed, water and stalls. If we force the cow to spend more than about 3.5 hours per day outside the pen, then she will need to give up something&emdash;typically feeding and/or resting. Every farmer should know how long their cows spend outside the pen.”
— Dr. Rick Grant, “Economic Benefits of Improved Cow Comfort,” 2015, p. 2.
Stall Comfort and Feed Availability Effects
It seems logical that comfortable cows would be more productive, and studies have documented this effect. Bedding factors (type, amount, moisture, maintenance), stall design (width, length, location of neck and brisket rails, etc.), and stocking density all affect resting time. Researchers documented an 11.6 pounds of milk advantage of sand over other bedding types in one study. Cows found the sand stalls more comfortable, rested more, and produced more milk. Costs of renovating stalls to implement recommendations for larger and softer stalls were recouped in an average of 1.9 years in one cow comfort economic study; benefits came from higher milk production, lower SCC, reduced lameness, and less culling.
Feed availability can be considered another aspect of cow comfort. Ensuring feed is always available to cows can result in four to eight more pounds of milk per day. Feeding more than once a day results in greater feed availability, but excessing feeding frequency (>three times in 24 hrs) ironically reduces cow resting time and DMI. Targets for maximizing feed intake include:
Empty bunk <3 hours a day (goal: 0 hours empty)
3% feed refusal
Understocked bunk capacity (allow 2’ per cow)
Feed TMR 2x/day with feed push up every 30 min. for 2 hours after feeding
Stocking Density, Parity, and Dominance Issues
Overstocking is a bad idea for so many reasons, not the least of which is cow comfort (Figure 2). Competition for feed causes cows to eat fewer meals but feed more quickly. In one study, cows in overstocked facilities were observed to eat 25% faster and rumination was reduced by an hour a day; milk fat was reduced, rumen health was compromised, and feed efficiency was reduced.
Figure 2. Effects of Overstocking
Increased
Decreased
Intercow aggression
SCCs
Health issues
Lameness
Feeding rate (slug feeding)
Alley standing time
Milk production
Milk fat
Reproductive performance
Resting
Rumination
Feed intake
Lower status animals (first calf heifers, smaller individuals, lame cows) will often choose to forego eating to avoid confrontations with more dominant individuals. When they do have bunk access, they often engage in slug feeding, which can result in chronic sub-acute ruminal acidosis and reduced rumination. Lower milk production, reduced milk fat, and increased lameness risk follow once again. Anything interfering with DMI in first-calf heifers is a concern because these animals still have nutritional growth requirements in addition to maintenance and lactation requirements.
Higher status cows often dominate the most comfortable stalls, too, so in addition to reduced access to feed, lower status animals may experience reduced resting time and therefore reduced rumination. If first calf heifers and other lower status animals can be separated from higher status animals, increased feeding time, meals per day, feed intake, lying time, and milk production should result.
Heat Stress Effects on Cow Comfort and Rumination
Genetic selection for higher-producing dairy cattle has resulted in animals that perceive heat stress at a temperature-humidity index of just 68°F. Management efforts to pro-actively address heat stress can prevent reduction of up to ten pounds of milk per day. Hot cows spend more time standing and less time lying down and resting, too; this is associated with decreased rumination, DMI and production and increased slug feeding and lameness. Actions to help keep cows cool include shade, fans, providing cooled water, periodic large water drops over shoulders in the presence of fans, and feeding 60% of the ration in the evening. Do not overlook addressing dry cow comfort related to heat—it is associated with a better transition period.
Conclusions
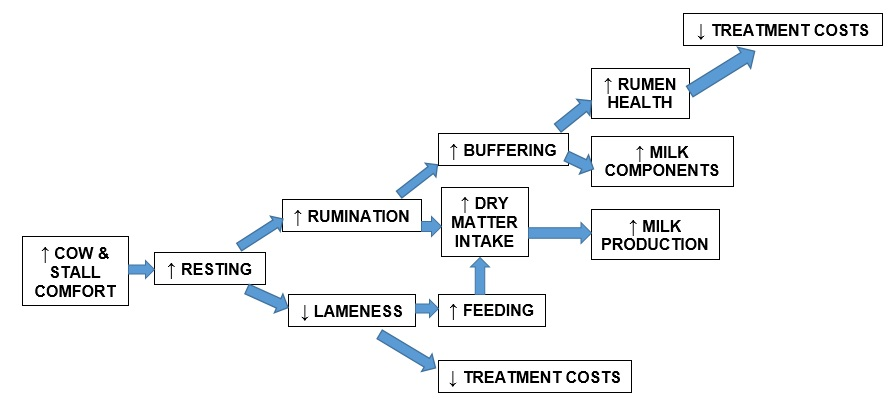
Figure 3. Flow chart on addressing cow comfort.
Figure 3 depicts the ultimate goals and outcomes of addressing cow comfort: increased cow longevity, increased milk quality and quantity, increased revenue, decreased expenses, and greater profitability, mediated through increased resting and rumination time.
Susan Kerr, NW Livestock and Dairy Extension, kerrs@wsu.edu
Warmer temperatures contribute to higher incidences of hoof ailments during the summer months. Management practices, including the use of footbaths and routine hoof trimming, are your best allied force against hoof disease. The Adams Progar lab at WSU will wrap-up a two-long study on behavioral indicators of hoof disease by the end of this year. Our study aims to test the effectiveness of an alternative footbath product compared to copper sulfate and identify the impact hoof disease has on cow behavior. In light of the upcoming summer heat, here is a review of information related to hoof health:
Annual estimated costs related to hoof disease
Mild cases of lesions (any form of lesion) cost an average of $169/affected cow; whereas, severe cases cost an average of $538/affected cow. When comparing incidences of digital dermatitis, sole ulcers, and white line disease, sole ulcers tend to incur the highest cost for treatment, labor, loss of milk, etc.
White line disease
The highest prevalence of white line disease occurs in older cows (4+ lactations) during late lactation (200+ days in milk). Keep this in mind as you observe your cows for hoof disease.
Digital dermatitis
The highest prevalence of digital dermatitis occurs in first lactation cows during late lactation (200+ days in milk).
Sole ulcers
The highest prevalence of sole ulcers occurs in older cows (4+ lactations) during mid-lactation (100-199 days in milk).
Rear feet vs. front feet
Lesions are 80% more prevalent in a cow’s rear feet than the front feet. This is one reason why at the WSU Knott Dairy Center, we have been working with a hoof specialist to analyze all lactating cows’ rear feet on a monthly basis.
Footbath products
While copper sulfate and formaldehyde are the most popular footbath products, alternatives (such as organic acids) have been shown to be as effective or slightly (4%) more effective than conventional products.
Hoof trimming
When comparing whole-herd hoof trims vs. partial-herd hoof trims (specific cows are selected to get hoof trimmed), herds that use partial-herd hoof trims have 40% higher prevalence rates for infectious digital dermatitis than whole-herd hoof trims.
Footbath use
Using a footbath on a bi-weekly (every two weeks) basis leads to nearly 25% more cows with active digital dermatitis than if a producer uses the footbath on a weekly basis.
Herd-level lying behavior
The average number of hours cows spend lying in a day (~10 – 12 hours) remains consistent, even if a herd’s lameness prevalence increases.
Cow-level behavior
First lactation cows spend less time lying for an extended period of time, which means they lie for a short period and then stand again. This improves as they progress through their first lactation. Thanks to Vantage Dairy Supplies, the Adams Progar lab is collecting cow behavior data with the CowManager® system (Figure 1). We hope to better understand how hoof disease impacts other behaviors, such as eating.
Figure 1. Example of behavior data collected from CowManager®. This graph shows how much time (as a percentage of the total day) a specific cow spent ruminating, eating, and being active during each day.
Amber Adams Progar, Dairy Management Specialist, amber.adams-progar@wsu.edu
Dear Dairy Farmers: Did you complete your Pest Bird Management Survey?
Figure 2. Survey reminder postcard.
A couple of weeks ago, you should have received a survey in the US mail or an email from the WSDF with a link to an online survey. Researchers from Washington State University and Trinity Western University are studying pest bird damage and current pest bird management practices used on Washington dairies. Our goal is to determine the true economic impact of pest birds on dairies and identify the most effective methods of pest bird deterrence. This survey is your opportunity to share how pest birds impact your farm. Please help our team help you. The deadline is July 1st.
If you would like more information about this project, please contact Amber Adams-Progar (amber.adams-progar@wsu.edu, 509-335-0673).
Since April, there has been a baby boom within the CUDS herd. After five months without heifers, we now have five! During the summer months, members are in and out of Pullman but still working on their projects and goals. Our sire selection and reproduction chairs are diligently working towards incorporating Jerseys into the CUDS herd. Jeff Wendler from Columbia River Dairy is graciously donating ten sexed Jersey embryos with the hopes of getting them implanted by the end of June. The calves, heifers, & dry cows and nutrition chairs are beginning the process of collecting urine pH’s in our close-up cows. The nutrition and herd health chairs are collaborating to test BHBA concentrations of our fresh cows to help detect incidences of subclinical ketosis thanks to a testing kit provided by Church & Dwight. The public relations chair is currently working on her project aiming towards introducing all our current members to the public through Facebook (follow us at CUDS of WSU). Throughout the latter portion of the spring semester and through the beginning of the summer, CUDS members have been meeting with industry professionals to prepare for CUDS Annual Review.
Dairy Nutrient Management Tools Workshops – Two Scheduled in Western Washington
Join us in Lynden on Wednesday August 1 or in Enumclaw Thursday August 2 for a closer look into how you can best manage your dairy farm nutrients with helpful and resourceful tools. Get the inside scoop about relevant state farm issues—nutrient and precision nutrient management, feed management, compost, manure and food safety, and irrigation.
Workshop is free of charge to all. Registration is not necessary, just remember to sign in when you arrive. Lunch and morning snacks will be provided. We hope to see you there!
Tuesday, August 1, 2017
Lynden Public Library (Lynden Meeting Room)
10:30 AM to 3:00 PM
Wednesday August 2, 2017
Green River College, Enumclaw Campus (Room 15 upstairs)
10:30 AM to 3:00 PM
Dairy Nutrient Management Tools Workshop Agenda
10:15 AM Registration, Coffee and Morning Sweets
10:30 AM What Goes in Must Come Out. How to Reduce on Farm Feed Imports of Nitrogen and Phosphorus – Joe Harrison
11:00 AM FNMP2.net: Connecting Feed Decisions with Crop Nutrient Management Plans – Joe Harrison and Liz Whitefield
11:30 AM Tools for Practical Irrigation Scheduling – Troy Peters
Noon Lunch (Provided)
12:30 PM Turn your Compost Up a Notch with the Compost Mixing Tool Calculator – Andy Bary
1:00 PM Precision Nutrient Management in Western WA – Doug Collins
1:30 PM Lagoon Liners. Case Studies from Three Dairies – Joe Harrison
2:00 PM Fall Soil Nitrate Testing- Factors Affecting Test Values – Andy Bary
2:30 PM Food Safety Implications with Manure – Andy Bary
The dairy industry has always been on the leading edge of advancements in animal science. Groundbreaking research in nutrition, genetics, technology and reproduction helped develop key management practices underpinning dairy profitability and worldwide competitiveness. The next major game changer is here: genomic testing is now available and affordable at the farm level.
A genome is the entire collection of an individual’s DNA. The bovine genome contains 22,000 to 25,000 genes. There are places on chromosomes where individual animals can differ in their DNA sequence. These markers are called “single nucleotide polymorphisms” (SNPs). SNPs are of great interest to geneticists because they help explain and predict differences between individuals.
Genomics examines how genes interact to influence how an individual develops. A tissue sample (such as an ear snip from a dairy calf) can be analyzed and a mass of data can be obtained about that animal’s genetic merit. It is no longer necessary to breed a bull or cow and keep records on its progeny’s performance to determine the parent’s breeding value, a process that takes years for initial data collection and many years for improved accuracy. Genomic testing now makes it possible to predict the potential performance of individual animals directly, saving time and hastening on-farm genetic progress.
In the early days of genomic testing, a computer chip was developed that could assess 50,000 (50K) SNPs in the genome of a submitted sample. This complete test remains expensive, but research advancements have resulted in chips that test 6K or 7K of SNPs for about $40 a sample and are nearly as accurate measures of genetic breeding value as the 50K test. Custom chips can be developed as well. Genomic results on each animal are submitted to the Council on Dairy Cattle Breeding, which calculates the predicted transmitting ability (PTA) of various traits. Producers can use an individual animal’s PTAs with the same confidence as high accuracy data from bull progeny tests.
The major focus of current genomic-based selection is on economically-important traits. For example, net merit dollars (NM$) is an estimate of lifetime profitability of a specific dairy cow compared to a baseline of same breed herdmates. NM$ is a favored indicator for selection because it includes several traits of economic importance, such as milk production, fertility, calving ease, health and longevity.
How can producers use genomic testing to benefit a farm’s bottom line? A group of replacement heifers could be tested and only those with high genetic merit could be selected for development. Those with lower genetic potential could be sold, bred to calving ease beef bulls for higher-value beef crosses, or kept as ET recipients. Sexed semen could be used selectively in high genomic breeding value heifers, justifying the higher cost of such semen.
In the future, producers will increasingly turn to genomic testing to reduce the incidence of involuntary culling factors such as lameness, mastitis and metabolic diseases. Genomic testing will identify animals with higher feed efficiency—another very valuable trait. Look for genomic testing results to start appearing in sale catalogs, too.
Something to keep in mind about all this selection for rapid genetic progress will be if and how management systems will need to change to accommodate these genetically-superior animals. For example, finely-tuned nutrition programs for these high production potential herds will be more critical than ever. Nevertheless, being able to identify and develop a farm’s best heifer prospects through genomic testing should help producers focus limited resources (such as space, feed and labor) on individuals with the greatest likelihood of contributing to farm profitability in the long run. Genomic testing is indeed worthy of the buzz it is receiving.
Susan Kerr, Northwest Regional Livestock and Dairy Extension Specialist, kerrs@wsu.edu
As we watch the snow melt and the grass grow green, you may notice a remnant from the colder weather lingering in your barns. This past fall, researchers from Washington State University and Trinity Western University recorded pest bird numbers on eleven Washington dairies. The number of pest birds (primarily European starlings) on these farms increased as temperatures dropped. The highest average number of birds recorded at any given time was almost 5,000 birds, with 92% of those birds being starlings.
Although temperatures are now rising, these large numbers of birds are expected to linger in dairy barns until mid-April to early May. Perhaps the number of birds we found on dairies surprised you but, according to a small survey of Washington dairy producers a couple of years ago, the pest bird problem seems to be a big problem for many dairies. Producers have self-reported losses from bird damage that range from $1,000 to $200,000 per year per farm. These losses, of course, cause concern. With this concern in mind, an interdisciplinary research team comprised of dairy producers, animal scientists, wildlife biologists, veterinarians, and agriculture economists. Our goal is to understand how the presence of pest birds on Washington dairies affects dairy cow welfare (including nutrition and health) and farm profitability.
Within the next month, our research team will release a wide-spread survey for all Washington dairies. Although this survey is thorough, it should only require minutes of your time to complete and your identity will be anonymous. This survey is your opportunity to share how pest birds impact your farm. Please help our team help you.
If you would like more information about this project, please contact Amber Adams-Progar (amber.adams-progar@wsu.edu, 509-335-0673).
Pest Bird Management on Dairies
Amber Adams-Progar, Karen Steensma, Susan Kerr & Stephanie Shwiff
1. Washington dairy farmers said…
Pest birds cause $1,000 – $200,000 in damage every year on our farms.
Common bird deterrence methods are not effective.
3. What we plan to do…
Measure economic impact of pest birds in Washington dairies.
Test efficacy of alternative bird deterrence methods.
2. We responded by…
Establishing a research team to address these problems.
Obtained a $238,105 Western SARE grant for research and education.
4. What we expect to find…
Presence of pest birds negatively impacts dairy cow well-being and production.
Alternative deterrence methods may be more economically feasible and effective than traditional methods.
CUDS is having an exciting spring semester in Pullman. We currently have 15 members, with 10 of them being new to CUDS. Our main focus is on training the new members to take shifts as well as take care of their newly appointed chair positions. Each member is assigned a chair position that is dedicated to improving an aspect of the herd.
President
Marcy Bartelheimer
Calves, Heifers, and Dry Cows
Brianna Parmentier and Adriana Lopez
Cow Comfort
Taylor Swick
Drugs and Supplies
Mica Jones
Finances
Marcy Bartelheimer and Caroline Vadino
Herd Health
Shelby Felder and Chris Mandella
Milk Quality and Udder Health
Tomoe Matsumoto-Hervol
Nutrition
Nathaniel Herrera and Heather Young
Records and Public Relations
Melissa Rauch
Reproduction and Sire Selection
Alecia Fox and Morgan Hawley
Lindsey Richmond, our President Emeritus, will be graduating in May. CUDS will greatly miss everything Lindsey has contributed to the group but we wish her the best in her future endeavors and know that she will serve the dairy industry well.
This group of students is excited to continue learning about the dairy industry. CUDS will have a booth at the National Holstein Association Convention in Bellevue, WA from June 28 – July 1, 2017. Please stop by and let us know if you have any questions.
Practical Biosecurity Recommendations for Dairy Farm Tours
Most Americans are now at least three generations removed from direct farming experience. This lack of knowledge and experience can manifest itself in consumers as misconceptions about modern farming practices; susceptibility to agenda-driven social media messages; and decisions based on inaccurate information. Farm tours can educate the public about best agricultural practices, strengthen connections between farmers and consumers, dispel misinformation, and cultivate the next generation of farmers.
Farm tours such as this can educate the public about the facts of modern dairy farm operations, for example, and help dispel misperceptions, confusion, and incorrect beliefs perpetuated through inaccurate sources. Photographer: Dorothy Elsner.
If you choose to allow farm tours on your dairy as a way to increase agricultural literacy, seriously consider the steps needed to reduce any risks such tours could pose to your farm, cattle, employees, and tour guests. Sponsoring educational events can be very rewarding, but it is no reason to lower disease-prevention standards. For more information about diseases of concern, contact local veterinarians and/or public health officials.
Why Care about Biosecurity?
Animal disease outbreaks have varying degrees of ripple effects on animal welfare and well-being, farm profitability, workload, product quantity and quality, ability to transport and/or sell animals, veterinary and medication costs, and human health. Incursions of new diseases onto formerly negative premises can result in the loss of added value of breeding animals that were previously disease-negative, as well. Education about the need for disease prevention should help moderate participants’ feelings of inconvenience regarding farm biosecurity requirements.
Biosecurity Strategies
Assess Risk
Biosecurity risk ranges from low to high. For farm tours, factors that increase risk include the number of different premises visited, degree of visitor contact with animals and/or manure, and the presence of contagious diseases in the area. The complexity of an event’s biosecurity plan depends on the specific pathogen(s) of concern and the desired degree of risk containment.
Communicate with Participants before the Event
Participants should pre-register so biosecurity expectations and other program details can be shared with them. Instruct participants to be punctual so access to the farm can be monitored. Explain what ages of children are allowed, if any. Do not allow visitors to bring dogs or other animals. Also, inform anyone who has travelled internationally within a week they will not be able to visit the farm.
Park Visitors Away from Livestock
Do not let participants drive their vehicles through your farm gate and onto your property where you drive your vehicles. Contaminated tires and overlap of farm and off-farm traffic is an important means by which some diseases are spread. Designate a location near the farm where people can park safely and walk onto the farm with clean rubber boots. If such a site is not possible nearby, consider running a shuttle service from a more distant site to the farm. Optimal parking sites are on paved areas that can be disinfected and where livestock are excluded. If pastures must be used for parking, livestock should be excluded from the area for several weeks.
Display Clear Signage
Post large, legible, waterproof signs that instruct participants where to park, where to go, and what to do. REGISTRATION, PARKING, THIS WAY, and EXIT are just a few suggestions that will help direct and control traffic and behavior. A WELCOME sign would help set a friendly tone for the event.
Insist on Clean Footwear and Clothing
It is critical for farm tour participants to wear clean clothing and disinfected footwear, especially if they live on a farm themselves. Anyone with soiled clothing or footwear should not be allowed access to the premises. The farm footwear and clothing policies should be shared during the pre-registration process and in all event promotional materials.
Varying levels of restriction are possible, depending on host farm risk tolerance and ease of implementation:
Farm hosts could require participants to change out of street shoes and into clean rubber boots at the car parking area; participants might need to bring their own clean boots or the farm host might provide them.
A boot washing and disinfecting area may be established at the car parking area for people to use before they enter the farm property. Washing boots thoroughly with soap and water to remove all visible debris before stepping in a disinfecting footbath will extend the effective life the disinfectant in the bath. Provide an appropriate disinfectant and long-handled boot brushes. If a disinfectant footbath is used, it should be monitored so the solution can be changed before it becomes visibly soiled and inactivated. Tour participants should wash and disinfect their boots again when they leave.
The farm may provide heavy-duty plastic overshoes to be worn throughout the event and discarded at the parking area before participants go home. The rustling noise created by plastic boots in motion can disturb some animals, though, and a lot of plastic waste can be generated. Also, these boots can develop holes that render them ineffective.
Additional boot washes may be required before entering cattle housing areas.
For added biosecurity, some farms supply clean cloth or disposable coveralls for participants to wear during tours.Consult with your veterinarian regarding the most effective disinfectant to use. Follow label directions regarding proper storage, dilution rates, and disposal methods. Ensure disinfectant efficacy by changing footbaths before they become visibly soiled and inactivated. It is pointless to use disinfectants if adequate contact time is not allowed.
Control Entry and Foot Traffic
Establish a single entrance for visitors. This will ease communication, information sharing, and monitoring of compliance with biosecurity protocols. After a reasonable arrival time has been allowed for the event, lock the gate and post a phone number latecomers can use to contact the host to request entry to the event. Unmonitored entry of latecomers will not ensure compliance with biosecurity protocols.
Farm visitors do not need to access all your property. Use gates—even temporary ones—to control access and foot traffic. Permanent locking gates in key areas help with overall farm security and are a good investment that helps prevent theft and damage.
Have a Greeting Area
Visitors should be funneled to a registration table or greeting area where they can meet the tour host, get a schedule, learn the locations of bathrooms and hand washing stations, and sign in. Visitor logs with accurate contact information are very important in case a human or animal disease outbreak necessitates follow-up contact after the event. This is a good time to welcome everyone, share your farm mission, and preview what will be shared during the tour. Be sure to review biosecurity expectations and see if participants have complied thus far with disinfected boots, clean clothing, and other guidelines. Use this time to ask participants to wash their hands, address any biosecurity deficiencies, and/or dismiss non-compliant visitors.
Keep Visitors Safe
Thanks to close supervision and clear delineation of danger area, this robotic dairy tour attendee can get a close look at the system without risk from cattle or equipment. Farm tours such as this can educate the public about the facts of modern dairy farm operations, for example, and help dispel misperceptions, confusion, and incorrect beliefs perpetuated through inaccurate sources. Photographer: Dorothy Elsner.
Do not permit visitors access to high-risk areas with working machinery, bulls, cows with calves, guard dogs, barbed or electric wire, grain bins, manure lagoons, gravel pits, etc. Do not allow strollers, pacifiers, eating, smoking, or drinking in livestock areas. If children are allowed on the tour, be sure parents supervise them at all times—this may require handholding.
Have hand-washing stations available for use after livestock area tours, at rest rooms, food service areas, entrances, and exits. Remind participants to wash hands after contact with animals, using the bathroom, and before eating or smoking. Alcohol-based hand sanitizers are not very effective if hands are dirty or greasy; such hands should be washed with soap and water. Hand sanitizers with at least 60% alcohol can be quite effective on visibly clean or lightly soiled hands.
Any food and beverage provided should be served in compliance with standard food safety practices: keep cold foods below 40°F and hot foods above 140°F, protect all food from insects, and use only potable water for beverages.
Control the Flow
Have a plan for the day with an established route and approximate amount of time needed at each station. Ensure there is enough room for all to see and hear what is being presented—this may necessitate dividing visitors into groups and using PA systems. Additional farm staff or volunteers may be needed to keep all participants in view at all times. Provide seating if needed for those who need to sit. Keep foot traffic away from cattle feed and feeding areas, manure, and carcasses. Visit young animals before mature animals. Keep visitors away from intake fans that bring air in from outside, past visitors, and onto cattle.
Limit Direct Contact with Livestock
Prevent needless contact with cattle—participants with limited previous livestock contact are at higher risk of contracting common but relatively innocuous conditions such as ringworm and sore mouth; this is particularly true for children. People who do contact livestock directly should be advised to wash contacted skin with soap and water promptly. Better yet, provide disposable gloves to those who might be learning hands-on skills.
Just Say No
Do not allow participants to bring dogs with them. In addition to disease transmission, injury to animals or people is possible if strange dogs are allowed on the farm premise. Also, unpleasant interactions are likely to occur between resident farm dogs and visiting dogs.
It is difficult to disinfect baby strollers, chairs, and wheelchairs properly, so discourage their use. Young children should walk, be carried, or left home. Farm-origin vehicles such as four-wheelers or golf carts can transport those who need assistance. Provide chairs, lawn area, or bedding bales for sitting.
Keep It Clean
Avoid conducting farm tours during rainy/muddy weather if possible. Situate garbage cans and paper towels throughout the tour. Give each participant a garbage bag to take to their vehicle for dirty boots and/or clothing to take home for laundering, disinfecting, or discarding.
Use the Right Disinfectant
A wide array of products is available to inactivate pathogens on farm equipment, tools, boots, livestock facilities, footbaths, and other surfaces. Disinfectants are not a shortcut to biosecurity and are just one aspect of disease control. Your veterinarian can suggest the most appropriate disinfectant to use. To increase the likelihood of disinfectant effectiveness and safe use, follow these recommendations:
Clean surfaces before using a disinfectant. Surfaces must be cleaned with soap and water and thoroughly rinsed or disinfectants may be inactivated by organic material present.
Read the label! Use a product with documented effectiveness against pathogens of concern under typical farm conditions of use.
Follow mixing instructions on the label and abide by safety warnings and recommendations for personal protective equipment use. Do not mix different types of disinfectants unless specifically indicated on their labels to do so.
Determine if farm water hardness or other factors will effect successful product use.
Store concentrated and diluted disinfectant as indicated on the label; create fresh solutions before each use of short-stability preparations.
Allow recommended contact time to ensure maximum kill of pathogens.
Do not let disinfectants contact livestock unless specifically stated on the label as safe and allowable.
If disinfectants are used on feeding surfaces or other livestock contact areas, rinse them off after the required disinfectant kill time and before animals contact the disinfected surfaces.
Dispose of used or non-storable chemicals as instructed on the label, paying close attention to personal and environmental safety.
Costs vs. Benefits
The biosecurity steps responsible for the greatest reduction of risk for the least cost are:
Changing clothing for employees who leave and return to a farm on the same day.
Establishing requirements before a vehicle can enter a premise.
Establishing parking areas away from dairy barns.
Preventing access to restricted areas if visitors have been in contact with cattle.
Providing plastic booties for visitors.
Installing signage advising visitors without authorization to stay off the farm.
Special Considerations for Certified Organic Livestock Production Systems
Organic livestock producers and processers must abide by the USDA’s National Organic Program regulations when using sanitizing agents that will contact organically certified crops, livestock, or food products (milk, eggs, and meat). Products not on the national list of approved substances might be allowed on a case-by-case basis by the organic program certifier if contacted in advance of the event and a determination of non-contamination is made. For example, a chemical not on the USDA’s National Organic Program list could be approved for use in a foot bath or boot wash if there is a safe place for legal disposal of the chemical residue off the organic property where it will not contact organic crops or livestock. Organic producers should always contact their certifier if they have any questions about products they would like to use for biosecurity purposes on a certified organic farm.
Summary
Although highly educational and enjoyable, farm tours come with certain risks. These risks include introducing new diseases or pathogen strains to host farm or participants’ animals as well as zoonotic (animal-to-people) disease risks to participants. Such risks can be mitigated through careful pre-event planning and protocol development. Transparent education about biosecurity concerns can add to the value of the event for prospective dairy cattle owners in attendance as well as keep the event enjoyable and safe. Each farm host will have to weigh the potential risks of hosting an event with potential benefits. If an event for the public will be held, following the above-mentioned suggestions should help reduce risks significantly. Consult your veterinarian for information about diseases of concern, appropriate disinfectants, and designing your biosecurity plan.