Skip to main content Skip to navigation
Washington State University Dairy News

June 2016 WSU Dairy Newsletter

Amber’s Top Ten Tips: Understanding Dairy FARM Evaluations

Approximately 90% of the milk supply in the United States currently participates in the National F.A.R.M. (Farmers Assuring Responsible Management) Program. Since its inception in 2009, the program’s participation has grown to include 82 co-ops and processors from across the nation. With the program’s increase in popularity, you most likely have already participated in an on-farm evaluation. I hope the information below will help you prepare for your next evaluation and encourage you to use some of the techniques below to monitor animal well-being on your dairy.

Last month, I completed the training to become a FARM Program on-farm evaluator. As I learned more about the program, I gained a deeper appreciation for how the program aims to emphasize “Animal Care is Everyone’s Responsibility”. Is the program perfect? No, but it is an honest attempt at uniting dairy industry stakeholders to achieve a common goal: provide the best care possible to dairy animals. These days, we need to unite as an industry in order to address the challenges that lie ahead.

Let’s take a closer look at the on-farm evaluation process and techniques evaluators use to monitor animal well-being:

  1. Importance of On-farm Evaluations

    Why do we conduct on-farm evaluations? What is the purpose? The basis of these evaluations is to assure consumers that dairy producers are providing optimal care to their animals and provide producers with resources to continually improve animal care.

  2. Second-party Evaluation

    These evaluations are conducted by certified evaluators like me that completed the FARM Program evaluator training. The process for these evaluations will be explained in-depth below. Over 33,000 second-party evaluations have been conducted.

  3. Entrance Meeting

    At the beginning of each second-party evaluation, the evaluator will ask you a series of questions about your farm. This is a perfect time for you to ask questions about the FARM program. Once the meeting concludes, the evaluator will proceed to the cow housing facilities to collect cow observation data.

  4. Hygiene Scores

    Cows are scored on a scale of 1 – 4, with a 1 representing a clean cow and a 4 representing a cow that has manure on her udder/belly and up towards her back. The goal is to have at least 90% of observed animals with a score of 2 or lower.

  5. Locomotion Scores

    The locomotion scoring system is on a scale of 1 – 3, with a 1 representing a cow sound on all four legs and a 3 representing a severely lame cow. The goal is to have at least 95% of observed animals with a score of 2 or lower.

  6. Body Condition Scores

    Body condition is analyzed by using a scale of 1 – 5, with a 1 representing a cow with no fat cover over her tail head, short ribs, hooks or pins and a 5 representing an obese cow. The goal is to have at least 99% of observed animals with a score of 2 or higher.

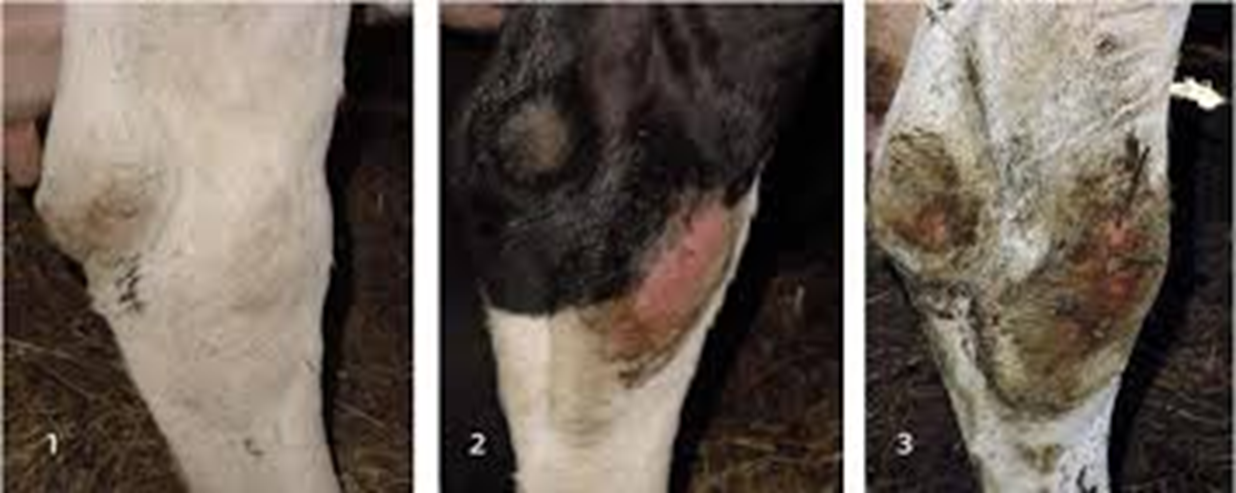
  7. Hock and Knee Lesion Scores

    Hock and knee lesion scores are evaluated on a scale of 1 – 3, with a 1 representing a cow that has hair loss less than the size of a quarter with no swelling and a 3 representing a cow with severe swelling and/or an abrasion. The goal is to have at least 95% of observed cows with a score of 2 or lower.

  8. Closing Meeting

    After the evaluator completes his/her animal observations, the evaluation will conclude with a closing meeting. The evaluator will discuss the observations with you, share any recommended areas for improvement, and, if needed, develop a corrective plan with you. Once again, consider this meeting to be an excellent opportunity to ask questions.

  9. Third-party Verification

    To maintain the integrity of the FARM program, a third-party (in this case, a company called Validus) selects a random sample of evaluated farms to verify each year. The objective is to test whether the third-party evaluators reach the same conclusions as the second-party evaluators. Approximately 750 third-party verifications have been completed.

  10. Effectiveness of the Program

    A 3% improvement in cow hygiene cores occurred from 2014 to 2015, in addition to a 2% improvement in locomotion scores and a 4% improvement in hock and knee lesions.

For more information (including charts on scoring hygiene, locomotion, and body condition) visit http://www.nationaldairyfarm.com/animal-care-program

Hock lesions scored from 1 (left) to 3 (right).
Hock and knee lesion scores

Interested about the future of water in the PNW?

Climate Impacts to Water banner

Join us for the Climate Impacts to Water Conference: Managing the Uncertainties of Water Supply and Quality in the PNW

The PNW’s $21.8 billion agricultural sector ($13.2 billion for crops and $8.6 billion for animals; USDA-NASS, 2013) is vulnerable to risks associated with climate change, especially, increased pressures on water resources in arid environments because of its reliance on regional climatic factors. Severe droughts are projected in semiarid regions of the U.S. during the upcoming century (Ault et al., 2014; Steinemann, 2014). Annual average temperatures in the PNW are projected to increase by 3.3 to 9.7° F by the end of the century and availability and timing of precipitation is also expected to shift (Mote et al., 2014). Excessive spring precipitation, longer freeze-free seasons, decreases in mountain snowpack, and reduced stream flow could also reduce available water, and further stress agricultural production and management (Mote et al., 2014; Abatzoglou et al., 2014; DOE, 2011).

In the PNW, seasonal variations in water supply and demand of the Columbia River Basin have resulted in localized water shortages that are expected to increase with competing demands for fresh water resources into the future (DOE, 2011). To reduce negative economic, social and environmental consequences associated with drought, agricultural producers, advisors and managers must be better informed about regional climate projections (immediate and long-term), on-farm water management, and conservation opportunities. There is a two day upcoming regional conference—Climate Impacts to Water: Managing the Uncertainties of Water Supply and Quality—occurring on January 25-26 at Skamania Lodge in Stevenson, WA. Regional agricultural producers, agriculture professionals, consultants, educators and specialists, NRCS, local and state employees and others interested in the topic are invited to more about the consequences and management of water in the PNW. Because agricultural advisors and similar stakeholders serve as key resources to producers for information about risks and management, increasing awareness and accessibility to relevant resources through this PNW Climate Impacts to Water conference will improve abilities to address concerns about sustainable water management, and risks to production systems and local environments.

The objectives of this conference are to:

  • Improve your understanding about projected climate impacts on water accessibility in the PNW, and learn about sustainable management decisions.
  • Create awareness of resources for adopting strategies that will make farming operations more resilient to climate change, while minimizing impact.
  • Build on the regional network of advisors and educators and take the knowledge gained at the conference and encourage adoption in the field

The areas of emphasis are:

  • Regional projections of climate and water supply
  • Multiple facets of water management, including agricultural and stormwater
  • Water conservation practices
  • Water policy, regulations and rights
  • Water quality
  • Social science communication concerning water

Registration and abstract information will be announced by July, 2016. To learn more about this regional effort, please contact Liz Whitefield e.whitefield@wsu.edu or visit: cm.wsu.edu/climateimpactstowaterconference

Cited Resources

  • Abatzoglou, J.T., D.E. Rupp and P.W. Mote. 2014. Seasonal climate variability and change in the Pacific Northwest of the United States. Journal of Climate. 27:2125-2142. doi:10.1175/JCLI-K-13-00218.1.
  • Ault, T.R., J.E. Cole, J.T. Overpeck, G.T. Pederson and D.M. Meko. 2014. Assessing the risk of persistent drought using climate model simulations and paleoclimate date. Journal of Climate. doi:10.1175/JCLI-D-12-00282.1. In press.
  • Department of Ecology (DOE). 2011. Columbia River Basin: Long-term water supply and demand forecast. Washington State Legislative Report 11-12-011. [Online]. Available at: http://www.ecy.wa.gov/biblio/11-12-011.
  • Mote, P., A.K., Snover, S. Capalbo, S.D. Eigenbrode, P. Glick, J. Littell, R. Raymondi and S. Reeder. 2014. Ch. 21: Northwest. Climate change impacts in the United States: The third national climate assessment. J.M. Melillo, Terese (T.C.) Richmond, and G.W. Yohe (Eds.).U.S. Global change Research Program:487-513. doi:10.7930/J04Q7RWX. [Online]. Available at: http://nca2014.globalchange.gov/report/regions/northwest. Accessed: 2014, October 9.
  • United States Department of Agriculture National Agricultural Statistics Service (USDA-NASS). 2013. State agriculture overview (WA, OR and ID). [Online]. Available at: www.nass.usda.gov/Quick_Stats/.
  • Steinemann, A. 2014. Drought information for improving preparedness in the western states. American Meteorological Society Bulletin:843-847. doi:10.1175/BAMS-D-13-00067.1

Logos for WSU Extension, Regional Approaches to Climate Change, Climate Impacts Research Consortium, State of Washington Water Research Center, Western Sustainable Agriculture Research & Education, and the Center for Sustaining Agriculture & Natural Resources


Celebrating—and Learning—during Dairy Month

On June 16-17, 2016, 96 Anacortes Junior High School students, teachers, and chaperones visited the Vander Kooy Harmony Farm #2 in Mount Vernon, WA. This visit was coordinated by WSU Skagit County Extension and included 4-H staff, a Master Gardener volunteer, and WSU faculty. Representatives of the Washington State Dairy Ambassador program also participated.

Each tour day featured one busload of students in the morning and another in the afternoon; many special needs students participated. Each group of students was divided into four sub-groups that rotated between four learning stations:

Station 1: Crops and soils discussion and demonstration.

WSU Skagit County Extension Director Don McMoran taught students about soil types, soil health, typical local crops, and how manure can benefit soil fertility and health. He sent each group home with a canning jar of soil suspended in water and instructed them to set it in their classroom and watch what happens as the particles settle. The students were eager to do this.

Station 2: Insect demonstration.

WSU Master Gardener Virgene Link brought an impressive array of preserved insect specimens to share with the students. She highlighted how most insects are non-problematic or even beneficial and we should not just reach for the “bug spray” when we see an insect. Students enjoyed looking at insects under a microscope and with magnifying glasses.

Station 3: Tools of the trade.

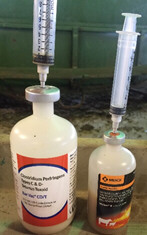
With assistance from advisor Annie Lohman, 2016-17 Skagit County Dairy Ambassador Juliana LeClair and Alternate Dairy Ambassador Leanna DeVries engaged students with a selection of the tools and used on a dairy farm. Students were introduced to water floats, moisture meters, A.I. straws, pH meters, esophageal feeders, OB chains, and balling guns to name just a few.

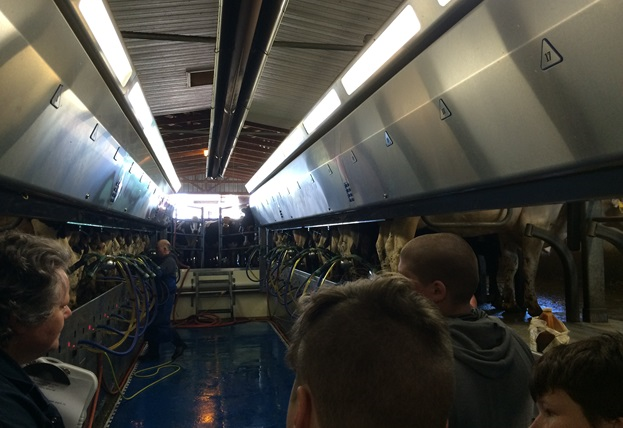
Station 4: Dairy cow milking, feeding, and welfare.

WSU Livestock and Dairy Extension Specialist Susan Kerr explained modern milking practices while students watched the process in the milking parlor. They learned about milk’s journey from cow to table, steps to insure milk safety and quality, and a cow’s lifecycle of production. They watched cows willingly enter the parlor and stand quietly for milking. Next they went to the freestall housing area and watched cows eat their TMR, relax, interact, ruminate, and make milk. Ways farmers keep cows comfortable, clean, healthy, and productive were highlighted.

Some questions, comments, or myths addressed during the tour included: “I heard boy calves are killed at birth;” “My mother says things are added to milk to make it taste unnatural;” “I heard that pasteurization destroys the nutrition in milk;” “Cows only have molar teeth;” and a favorite, “Is it true that a cow could eat a human?”

Tour participants left the farm knowing where dairy products come from, what it takes to make milk, and how much producers care about cow comfort and welfare. They saw firsthand how technology and mechanization have made farms more efficient and productive, keeping food prices low. Students learned how American dairy farmers feed the U.S. and the world.

Although time consuming and a bit of an inconvenience on a working farm, such educational tours can go a long way toward dispelling common myths and misunderstandings about dairy production. If you are interested in partnering with a school in your area to host such an event and need some assistance, please contact Susan Kerr at 360-848-6151 or kerrs@wsu.edu.

Thank you, Vander Kooy family!

Tour group viewing milking parlour.
Anacortes Jr. High School students learn how cows are milked at the Vander Kooy Harmony Farm #2 in Mount Vernon.

March 2016 WSU Dairy Newsletter

Beat the Heat and Save Money Doing It; Make a Plan Now to Avoid Heat Stress

It’s never too early to start thinking about management strategies to minimize the impact of summer heat on cows. It just takes one real hot period of heat to put a big dent in milk production and reproductive performance. Last summer in 2015, Sunnyside, WA saw 45 days above 90°F, and 10 days above 100°F (NOAA). Sunnyside, WA normally sees approximately 38 days above 90°F (period of 1895 to 2013; NOAA). The highest temperature last summer reached 108°F on June 28, 2015. That record hot day wasn’t in late July or early August, as normally expected, but was in June, and was also part of a 9 day stretch of high temps above 99°F degrees.

In addition to extreme heat waves, warming temperatures associated with climate change will enhance the negative impact to milk production; considering dairy cattle are extremely vulnerable to extreme high temperatures and humidity. A study investigating the impact of climate change on milk production found that concentrated dairy farming areas that are currently experiencing the greatest heat related impacts (e.g., Arizona, Florida) are also predicted to experience the greatest additional losses with climate change (Mauger, et. al., 2014). Figure 1 (below) demonstrates the loss of milk production on an annual scale comparing the historical temperature humidity index (THI) to the THI projected in 2050 with climate projections for selected concentrated dairy farming regions in the U.S. In the next 30 years, the Yakima region would expect an impact of approximately 13 lb (6kg) of milk loss/cow/day.

Adapting to hotter periods of heat, and more frequent periods of heat during the summer months is a critical reality to avoid economic losses. The USDA Economic Research Service (Key, et. al., 2014) found in 2010, that the impact of heat stress caused the average US dairy about $39,000. Climate models project that heat stress will “cause production loss to almost all US dairies, with 4 to 18 percent of dairies experiencing a loss greater than 2%” (Key, et. al., 2014). Figure 2 (below) shows a visual scale of projected temperature change for each season (Implications of Climate Change in the Pacific Northwest, Island Press, 2013). It is clear that summer will become the critical season for dairies to build resiliency on their operation, and beat heat stress.

Adapting to extreme periods of heat will prove to be the key piece to avoid harsh economic losses in a changing climate (Mauger, et. al, 2013; Key, et. al., 2014). Cooling methods such as shades, fans, ventilation and easy access to fresh water are essential to cooling cows, but the industry is seeing more and more producers adopt evaporative cooling systems to cope through the high temperatures. Some examples of evaporative cooling systems on dairies are soakers, misters, foggers, cooling stall pads and cooling barn walls. Evaporative cooling occurs when water is evaporated, and the energy (heat) used to evaporate the water cools the evaporative source (skin or the air, depending on the method). Farmers that have invested in heat stress abatement strategies say the initial investment is well worth the money, and pays for itself quickly. Take a few minutes to see how J &K Dairy farm in Sunnyside, WA made the decision to invest in soaker cooling technology by clicking on the link below.

With the periods of heat increasing, and arriving earlier in the summer and later into the fall, it is necessary that dairies are prepared to cool their cows effectively and efficiently to maintain healthy cows and keep profit margins. In the video link below, Joe Harrison (Washington State University), Jay Gordon (WA State Dairy Federation) Guillaume Mauger (University of Washington), and Jason Sheehan (J&K Dairy, LLC) are interviewed to provide information and education on the topic of climate change impacting dairy production and how producers are successfully adapting to the heat.

An adaptation guide planning workbook specifically designed for animal agriculture is available online to assist in identifying farm vulnerabilities to climate associated risks. This workbook is available to help producers, consultants and advisors make decisions to build resiliency on an individual livestock operation.

For more on animal agriculture and climate change, visit extension.org/60702

Graphs for historical and projected milk loss in 10 locations.
Figure 1. The annual cycle of milk loss (kg/day) for selected counties for the historical period (1950-1999) and projections for the 2050s. Black lines show the cycle of loss computed from S. Pierre, Cobanov and Schnitkey (2003; Equaltion 2), gray lines show the results of the linear loss relationship by Hayhoe et al. (2004; 1.15 kg/°C loss after temperature exceeds thresholds of 25°C and 32°C respectively). Figure and figure description taken directly from Mauger et.al., 2013.
Maps represent temperature change by season in the Pacific Northwest.
Figure 2. A visual scale of projected temperature change for each season in the Pacific Northwest (Dalton, eds., 2013- Implications of Climate Change in the Pacific Northwest, Island Press). The North American Regional Climate Change Assessment Program (NARCCAP) is a program comprised of various institutions simulating global and regional climate assessment models.

References

  1. Dalton, M., P.W. Mote, and A.K. Snover, eds., 2013: Climate Change in the Northwest: Implications for Our Landscapes, Waters, and Communities. Pg. 36. Island Press.
  2. Key, Nigel, Stacy Sneeringer, and David Marquardt. Climate Change, Heat Stress, and U.S. Dairy Production, ERR-175, U.S. Department of Agriculture, Economic Research Service, September 2014.
  3. Mauger, G.S., Bauman, Y., T. Nennich and E.P. Salathe’. 2014. Impacts of climate change on milk production. Professional Geographer, doi:10.1080/00330124.2014.921017
  4. National Oceanic and Atmospheric Administration, Sunnyside Station (GHCND: USC 00458211) Record of Climatological Observations, National Center for Environmental Information, 151 Patton Ave, Asheville, NC 28801 www.ncdc.noaa.gov

Results of the 2014 NAHMS Dairy Study

The USDA’s Animal and Plant Health Inspection Service is responsible for the National Animal Health Monitoring System (NAHMS). Each year, NAMHS focuses on a different aspect of the livestock industry to study. The dairy industry was studied in 1992, 1996, 2002, 2007, and 2014. A calf component was added to the 2014 study; data collection lasted from 2014-2015 and these results will be shared in a future article.

Objectives for the 2014 study were determined with input from consultants, producers, veterinarians, Extension educators, and university faculty. The selected objectives were:

  1. Describe trends in dairy cattle health and management practices.
  2. Describe management practices and production measures related to animal welfare.
  3. Estimate within-herd prevalence of lameness and evaluate housing and management factors associated with lameness.
  4. Evaluate heifer calf health from birth to weaning.
  5. Describe antimicrobial use and residue prevention methods used to ensure milk and meat quality.
  6. Estimate the prevalence and antimicrobial resistance patterns of select foodborne pathogens.

To kick off the 2014 Dairy Study, an extensive questionnaire was completed by participating producers, then an additional in depth, on-farm survey was conducted; this survey focused on farm usage of veterinarians and antimicrobials, among other topics. Trained NAHMS representatives also conducted on-farm cow evaluations (lameness scores, hock scores, and body condition scores) and collected samples (composite fecals, bulk tank samples, and milk filters) for testing.

Data was collected from 17 of the major U.S. dairy states and represent 77% of dairy farms and 80% of dairy cows. In Washington, 110 dairy farms were invited to complete the questionnaire, which 41 completed. Eleven farms participated in the on-farm survey, cow evaluation, and sample collection.

Dr. Jason Lombard of USDA APHIS led the dairy study and is overseeing data analysis and publications. “Dairy Cattle Management Practices in the United States, 2014” (pdf) is the first publication produced by NAHMS using the study data. The selected graphics below are excerpted from that publication. Data are reported according to production system (conventional, grazing, combination, or organic) and farm size (very small, small, medium, large). Some comparisons are made between eastern and western U.S. herds.

Table 1. NAHMS Study Herds Descriptions. Operation average RHA milk production (lb/cow) by operation type and by herd size: (original table)
Operation type Operation Average RHA Milk Production (lb/cow)
Herd Size (number of cows)
Very small
(< 30)
Small
(30-99)
Medium
(100-499)
Large
(>500)
All operations
lb/cow Std. error lb/cow Std. error lb/cow Std. error lb/cow Std. error lb/cow Std. error
Conventional 20,340 (1,337) 20,254 (313) 22,624 (276) 25,493 (150) 21,862 (188)
Grazing 9,677 (1,289) 16,450 (1,058) 17,265 (1,964) 21,971 (2,187) 14,513 (983)
Combination of conventional and grazing/other 15,768 (821) 18,155 (430) 19,655 (488) 22,990 (1,349) 17,815 (351)
Organic 10,357 (1,245) 14,889 (812) 16,691 (1,102) 20,015 (1,137) 14,758 (709)
All operations (792) 15,405 18,990 (248) 21,706 (247) 25,273 (153) 19,932 (183)

Operation Average Percent Cows

Table 2. Operation average within-herd prevalence of cows by locomotion score, hock score and low body condition score and by herd size. Locomotion Scores (lameness) according to housing type. LS1 = lameness score 1 (no lameness); LS2 = lameness score 2 (mild/moderate lameness); LS3 = lameness score 3 (severe lameness).
Evaluation ParameterHerd Size (number of cows)Region
Small
(30-99)
Medium
(100-499)
Large
(500 or more)
WestEastAll Operations
Pct.Std. errorPct.Std. errorPct.Std. errorPct.Std. errorPct.Std. errorPct.Std. error
Locomotion score
Sound (LS=1)90-1.589.5-1.592.2-0.792.3-1.189.9-190.2-0.9
Mild/moderately lame (LS=2)7.7-1.47.3-0.96-0.56.3-17.4-0.87.2-0.7
Severely lame (LS=3)2.3-0.53.3-0.71.9-0.31.4-0.32.7-0.42.6-0.3
Lame (LS>1)10-1.510.5-1.57.8-0.77.7-1.110.1-19.8-0.9
Hock score
No lesions (HS=1)73.5-4.689.9-1.793.6-1.193.2-1.881.4-2.682.8-2.3
Mild/moderate lesions (HS=2)20.7-3.58.3-1.45.3-16.4-1.714.6-2.113.6-1.8
Severe lesions (HS=3)5.8-1.31.8-0.41.1-0.20.5-0.24-0.73.6-0.6
Hock lesions (HS>1)26.5-4.610.1-1.76.4-1.16.8-1.818.6-2.617.2-2.3
Body condition score
Thin (BCS<2.25)9.7-32.8-0.62.3-0.41.8-0.46.5-1.76-1.5
Bar graph of hock score by housing type.
Figure 2. Hock scores according to housing type. HS1 = hock score 1 (no lesion); HS2 = hock score 2 (mild lesion with hair loss but no swelling); HS3 = hock score 3 (severe lesion with swelling and/or ulceration).
Bar graph of percentage of thin cows by housing type.
Figure 3. Percent of thin cows (body condition score of 2.25 or less) according to housing type.

To address the study’s objective of estimating the prevalence of selected foodborne pathogens (Salmonella, Campylobacter), fecal samples were collected from various sites on participating dairies. Percent of various sized farms with at least one positive test for these pathogens are depicted in Figure 4.

Bar graph of fecal pathogen positives by size of operation.
Figure 4. Percent of various sized farms with at least one positive test Salmonella or Campylobacter.

Bulk tank and milk filter samples were collected to estimate the prevalence selected foodborne pathogens (Salmonella, Campylobacter, Listeria, Salmonella dublin). Percent of various sized farms with at least one positive test for these pathogens are depicted in Figure 5.

Bar graph of percentage of operations of various sizes with a milk pathogen detected.
Figure 5. Percent of various sized farms with at least one positive test for Salmonella, Campylobacter, Listeria or Salmonella dublin.

More results will be shared in future articles. Those interested in complete results from the 2014 Dairy Study can access publications when posted on https://www.aphis.usda.gov/aphis/ourfocus/animalhealth/monitoring-and-surveillance/nahms.


Amber’s Top Ten Tips: Feeding Forages to Pre-weaned Calves

Did you know that about 50% of dairy producers surveyed in 1992 offered hay to calves within the first 14 days of life? In 2014, only 20-30% of producers reported offering hay to pre-weaned calves and the first offering typically didn’t occur until calves were 30-58 days old. What happened? What caused the dairy industry to reconsider feeding forages to pre-weaned calves? I recently presented a talk in Lynden, WA, on these very topics.

One producer applied the information he/she learned during my talk and began offering hay to calves at seven days of age. Previously, the producer waited to offer hay until calves reached 40 days of age (calves are weaned at 80 days of age on this particular dairy). The results this producer noticed were encouraging and he/she contacted me to share the news. Not only were the calves eating more starter grain than usual, but they were also starting to eat grain at an earlier age. On top of that, calves were consuming more water than usual. We are all curious to see how these calves look a couple of months from now. Will they wean at a heavier weight? Are there long-lasting effects of feeding hay at a younger age? For now, we will just have to wait and see.

I summarized my talk into the ten tips listed below, but you may also access the video of my talk at https://www.youtube.com/watch?v=n9XK8vyAjIM. I hope you find this information to be useful as you contemplate whether feeding forages to your pre-weaned calves would be a good fit for your dairy.

What you need to know about the advantages and disadvantages of feeding forages to pre-weaned calves:

  1. Energy and Digestion.

    Starches are known to provide more energy per unit and are more quickly digested than forages. This is one reason why starter intake has been preferred over forage intake for pre-weaned calves.

  2. Rumen Development.

    Another reason starter grains have been preferred over forages is because volatile fatty acids (VFAs) from forages may negatively impact rumen development. A 1962 study found that pre-weaned calves fed hay developed 63-67% fewer papillae in their rumens. The papillae, as we know, play a key role in the absorption of nutrients in the rumen.

  3. Appetite.

    Consuming forages may lead to “gut fill”, where the forages suppress a calf’s appetite and less starter feed is consumed by the calf.

  4. Dry Matter Intake.

    The consumption of hay during the pre-weaning period may actually lead to increases in pre-weaning (up to 15% increase) and post-weaning (up to 38% increase) dry matter intake.

  5. Body Weight.

    Forage feeding in pre-weaned calves has been associated with heavier weaning weights (increases up to 9%), but not all studies support this claim. No differences in body weight have also been documented.

  6. Average Daily Gain.

    A 36% increase in average daily gain was reported in calves fed alfalfa hay during the pre-weaning period.

  7. Feed Efficiency.

    Offering forages to pre-weaned calves does not appear to influence feed efficiency.

  8. Heart Girth.

    Calves fed hay during the pre-weaning period had slightly larger heart girths (a 2% increase).

  9. Abdominal Girth.

    The addition of hay to pre-weaned calf diets has resulted in larger abdominal girths (a 6% increase).

  10. Future Performance.

    Few studies have evaluated the long-term effects of feeding forages to pre-weaned calves. Our understanding, thus far, is that this diet does not impact a calf’s future performance (reproductive success or future milk yield).

December 2015 WSU Dairy Newsletter

Ammonia Emissions Below Levels of Concern for Human Health

A question was recently posed to WSU faculty in regard to the concentration of ammonia that might be in dairy barns and if it would present a problem for human health. The short answer is no. A national monitoring study funded by the EPA looked at ammonia emissions in dairy barns across the US. One of the locations studied was in eastern Washington.

Average concentrations of ammonia in the barn ranged between 0.16 to 2.88 pm. These concentrations are significantly below the 50 ppm (averaged over an 8-h shift) permissible exposure limit (PEL) set by the Occupational Safety and Health Administration (OSHA) and the 25 ppm 8-h shift-averaged National Institute for Occupational Safety Health recommended exposure limit (REL) (NIOSH, 2011). The concentrations in the barns also were considerably lower than the NIOSH 15-min REL of 35 ppm. These data indicate that even in the rare event that a farm worker is in the barn for an entire 8-h shift, there should be little safety or health concern from exposure to ammonia.


Amber’s Top Ten Tips: Understanding Group Housing in Calves

Have you considered transitioning your current calf management practices towards a group housing system? I would not be surprised if the thought has crossed your mind at least once. Dairies throughout the country have recently paid more attention to the concept, and why wouldn’t they? With the prospects of reductions in labor expenses and improved animal welfare, this type of system sounds appealing; however, group housing presents its own challenges for successful calf rearing. For now, let’s put aside the financial aspects of group housing and focus on how pair or group housing systems impact calf behavior, health, and growth. The next time group housing crosses your mind, please take the following tips into consideration.

What you need to know about the advantages and disadvantages of pair/group housing in pre-weaned calves:

  1. Social Interactions

    Upon introduction into larger post-weaning groups, pair-housed calves exhibit more (up to 71%) social behavior than calves housed individually.

  2. Aggression Behavior

    In social environments (such as post-weaning groups), calves housed in pairs and groups are 32-60% less aggressive towards other calves than calves housed individually.

  3. Acceptance of Novel Foods

    Group-housed calves are, on average, 50% more likely to begin eating novel foods before individually-housed calves. Why does this matter? Dairies adjust their rations throughout the year (possibly including the addition of unique feedstuffs), in which cows must adapt to diet changes.

  4. Time Spent at Feeder

    Pair-housed calves spend 26-59% more time at the feeder than individually-housed calves.

  5. Visits to the Feeder

    Upon introduction into larger post-weaning groups, pair-housed calves are 42-82% more likely to attend the feed bunk before individually-housed calves.

  6. Heart Rate

    A lower (about 13%) heart rate was measured in pair-housed than individually-housed calves when they were exposed to a novel environment. Why does this matter? An increased heart rate is associated with the physiological stress response, leading to potential detrimental impacts on cow health and production.

  7. Respiratory Disease

    Individually-housed calves are 57-71% less likely to develop respiratory disease than group-housed calves, in general (this is highly dependent on the size of groups).

  8. Antibiotic Resistance

    The odds for antibiotic resistance in E.coli is 50% lower for calves housed individually than calves housed in groups.

  9. Starter Feed Intake

    Pre-weaning starter feed intake is typically higher (about 37%) in pair-housed calves than individually-housed calves. Post-weaning intake also tends to be higher (about 18%) in pair- or group-housed calves.

  10. Average Daily Gain –

    Improved average daily gains have been noticed in pair-housed (14% increase) and group-housed (16% increase) calves over individually-housed calves.

Four calves laying in a group pen.


Let’s Keep It Clean, Folks

Iatrogenic, (eye-AT-ro-JEN-ick), adjective. “Of or relating to illness caused by medical examination or treatment” (The Oxford Pocket Dictionary of Current English, 2009).

Are your medication handling and storage protocols a source of iatrogenic illness on your dairy? With so many uncontrollable factors dairy farmers have to deal with (fuel prices, weather, feed availability, etc.), it may be comforting to learn that a few simple practices can greatly reduce the likelihood of problems resulting from contaminated medications.

The photos used in this article are NOT from Washington State dairies and some are not even from the U.S. Nevertheless, they illustrate breaches in sanitation that can happen anywhere if shortcuts in best practices are taken due to haste, lack of training, or lack of concern about routine preventative measures.

Photo 1a shows an unsurprising source of medication contamination: manure. Controlling external contamination of medications with manure is a good practice for at least two reasons: it reduces the likelihood of transferring fecal organisms into the medication itself (Photo 1b) or other surfaces. Other surfaces include human hands (then water faucets, handles, countertops, etc.), thus putting human health at risk. It is easy to become complacent about surface contamination on dairies—note the coffee mug in Photo 1a—but small actions to improve sanitation may prevent large health problems with animals down the line.

Problem: Medication contamination with manure.

Solution: For medications commonly used cow-side that can be kept at environmental temperatures, consider keeping them in a washable plastic flip-top cooler to keep them clean.

Storing medications according to the manufacturer’s label instructions is critical. Upon arrival or purchase of any medications or vaccines, storage instructions on the label should be followed immediately. Only draw up or mix enough vaccine that can be administered within 30 minutes; remaining vaccine and/or un-mixed components should be kept according to label instructions (usually cool) until use. Keep thermometers in medication storage areas and monitor storage temperatures regularly; do not purchase vaccines over-the-counter if the business’s refrigerator temperature is not within vaccine label parameters (Troxel et al. 2009).The vaccines in Photo 2 were left at room temperature overnight, rendering them useless and a waste of money.

Two vaccine vials sitting on a counter with syringes piercing the cap.
Photo 2. Vaccines left at room temperature. Photo courtesy of Dr. Anita Varga.

Problem: Improper vaccine storage temperature.

Solution: Unless using them within 30 minutes, keep vaccines stored as instructed on the manufacturer’s label.

Photo 3 depicts medications kept in a refrigerator—they have been protected from dirt and manure (yay!) but the refrigerator was not working (boo!). Photos 2 and 3 also illustrate another all-too-common sanitation no-no: leaving a needle and syringe inserted into a medication bottle top for a prolonged time. Dust and other debris can enter the syringe chamber and contaminate it. Also, the rubber stopper top is not able to “repair” itself from the needle’s insertion. Many individual needle insertions can weaken a rubber stopper, leave large holes that can permit contamination, and even send small rubber fragments into the medication. Using a “nurse needle” (see below) is a practical way to protect the integrity of a rubber stopper medication top and address sanitation concerns.

Several bottles of medications stored with syringes piercing their caps.
Photo 3. Leaving needle and syringe inserted into medication. Photo courtesy of Dr. Paul Biagiotti.

Problem: Leaving needle and syringe inserted into medication bottle for prolonged periods.

Solution: use a nurse needle for each session of medication use and never leave needles in bottle top rubber stoppers for prolonged times.

Steps to Keep New Medications Sterile

  1. Flip metal, plastic or foil cover up but do not detach.
  2. Clean top of rubber stopper with alcohol.
  3. Crack open and insert a new nurse needle into medication top, retaining plastic cap (Photos 4a, 4b, 4c); do not remove the nurse needle from the rubber stopper top until the last dose is drawn up for a group of similar treatments of the same medication or vaccine.
  4. Attach a new syringe to the nurse needle and draw up the required dose of medication or vaccine.
  5. Detach filled syringe from nurse needle and leave nurse needle in top of bottle.
  6. Cover nurse needle hub with the plastic cap while injecting cattle.
  7. Use a new needle for each individual animal.
  8. When it is time to refill the syringe, use the nurse needle still in the medication top: attach same syringe to nurse needle, draw up dose(s), detach syringe from nurse needle, leave nurse needle in medication top, attach new needle to syringe, inject next animal, repeat.
  9. The nurse needle can be used for an individual animal injection after the last syringeful of medication or vaccine has been drawn into the syringe.
  10. If possible, fold metal, plastic or foil cover down to original position to protect medication bottle’s rubber stopper until next use. A protective cap of aluminum foil or plastic wrap could also be applied and rubber-banded in place.

Save the plastic hub after opening needle and use it to cover nurse needle while not in use.

Not everyone who works on a dairy farm has previous experience with livestock medications, including proper care, handling, and storage (Photo 5). Correct use of medications should be part of all new worker training and presented by someone fully aware of all aspects of sanitation and correct use. Through effective training and modeling of correct behavior, sanitation practices can easily become habits for new workers.

Photo 5. Lack of attention to the importance of proper medication handling and storage. Photo courtesy of Dr. Terry Wollen.

Problem: Lack of attention to medicines and their importance, handling, and storage.

Solution: teach employees about the crucial role medications play in animal health and train them about proper medication handling and storage.

Proper medication handling, storage, and use will save money, reduce product contamination, increase the likelihood of treatment success, and reduce iatrogenic illnesses. Dairy farms are busy enough without having to treat problems that could have been prevented through simple sanitation practices.

Reference

  • Troxel, T.R., and B.L. Barham. 2009. Case Study: The Temperature Variability of Refrigerators Storing Animal Health Products. Professional Animal Scientist 25:202-206.

September 2015 WSU Dairy News

Check Your Forage for Nitrates

The recent heavy rains that have followed a summer of record heat have created a situation where we could see high nitrates in forages harvested in late August and early September.

The dry July and August likely resulted in soil that was low in moisture and did not allow soil microbes to effectively convert manure nitrogen into nitrate for uptake by forages.

Now that we have seen record rainfalls in recent weeks, the soil microbes have the moisture they need and are likely active again and converting organic nitrogen into nitrate.

If your forage is high in nitrate, it is possible for as much as 50 % of it will get converted to ammonia when in the silo. While this reduces the risk of nitrate on the animal, the silage will likely have high levels of soluble nitrogen. The higher level of soluble nitrogen in the diet can be a challenge for ration formulation.

Consider sending samples of the fresh cut forage for a nitrate test, and if high, be ready to have the silage tested for nitrates and soluble nitrogen prior to feeding.

Table 1. Guidelines for using Feeds of Known Nitrate Content.
Original Source: Hoards’s Dairyman August 25, 1970.

Some laboratories report nitrate analysis as percent or PPM (parts per million) of KNO3 or NO3-N. To use the above explanation tables, multiply % or PPM of KNO3 by 0.61, or the % or PPM of NO3-N by 4.4 to get the comparable % or PPM of NO3.

%NO3 on 100 % DM Basis Comment
Less than 0.44% (4400 PPM) Safe
0.44 to 0.88% (4400 to 8800 PPM) Generally safe when fed balanced rations. Best to limit it to half of the total dry ration for pregnant animals and also be sure water is low in nitrate.
0.88 to 1.5% (8800 to 15,000 PPM) Limit amount to less than half of total dry ration. Be sure ration is well fortified with energy, minerals and vitamin A.
Over 1.5 % (15,000 PPM) Potentially toxic—do not feed.

CUDS Update – WSU Cooperative University Dairy Students

The cooperative University Dairy Students are going strong with 13 new and continuing members. The herd continues to improve its productivity, reproductive performance and milk quality. They averaged between 87 to 90 lbs/d all summer and maintained over a fat test of over 3.6 and protein over 3.1. The SCC is routinely under 100,000.

Their attention to reproduction has been so diligent that they are now milking 12 fourth and fifth lactation cows out of a herd of 40! The pregnancy rate is consistently over 20%. They have one 90+ excellent Holstein, one 86 VG heifer and several animals classified over 85.

Current members are: Marcy Bartelheimer, Emily Beebe, Joe Britt, Chandler Byington (President), Parker Byington, Jennifer Callanan, Megan Chihak, Teresa Erwin, Kevin Gavin, Landon Macy, Dana McCurdy, Grace Montgomery, Maite Muse, Meghan Nyquist, Shane Reed, Conrad Reisenhauer, Lindsey Richmond, Kelby Stadt, Stephanie Van Volkenburg, Mark Vetter, Gavin Voelkers, and Kristen Wedam. The CUDS faculty advisor is John McNamara.

The undergraduate dairy program at WSU is going strong!


No Longer on the Horns of a Dilemma

Dairy producers know dehorning or disbudding of dairy cattle is a long-established best practice that benefits human and animal safety and welfare. With a growing research base supporting the need for and effectiveness of pain control during these routine practices, progressive producers are wondering if and how they should change their horn removal protocols.

Destroying horn buds by either caustic paste, burning, or gouging have long been the primary means of disbudding calves. Within the past decade, many studies have shown the use of local anesthetic and non-steroidal anti-inflammatories are inexpensive and effective ways to control disbudding-related pain in calves. The use of a sedative has the added benefit of reducing the stress calves experience when handled for disbudding.

Day-old calves are not yet very active and usually unable to scratch their head with a hind foot. They are also often placed in single-calf housing. Both these factors help make disbudding with caustic paste on Day 1 of life safer because risk to non-target tissues of the calf or other animals is minimal.

A protocol to consider, developed after a discussion with beef and dairy veterinarians:

  1. Make sure the day-old calf has a good meal before starting. Your veterinarian may recommend adding a non-steroidal anti-inflammatory to the bottle.
  2. Sedate the calf (ask veterinarian about medication and dosage).
  3. Block nerves with local anesthetic (again, consult veterinarian). Allow adequate time to pass before completing procedure.
  4. Clip hair around horn bud. A very close clip with clippers will allow use of less paste or burning time and less unnecessary tissue death will occur.
  5. If disbudding via gouging, switch to caustic paste or burning because these methods have fewer complications.
  6. If disbudding via burning, burn until a ring of tissue around the bud base has turned a uniform copper color; burn the bud itself as well.
  7. If using caustic paste, create an outer ring of petroleum jelly to confine paste to horn bud area. Use a designated syringe to apply a thin dime-sized amount of paste to the entire horn bud and base if hair has been clipped close; a thicker and larger area of paste may be needed if hair has not been clipped close. Scratch the horn bud and its base with the tip of the syringe to roughen up the targeted tissue a bit.
  8. Administer anti-inflammatory if not done before the procedure.

If caustic paste is used, some veterinarians recommend wiping it off with gauze after 1 hour, others say after 24 hours. The paste should have done its work after just a few hours and removal will reduce the risk of damage to non-target tissue. Also, if calves nurse from dams instead of a bottle, do the procedure after the evening meal and separate the cow and calf; remove paste before returning the calf to its mother.

Consult with your veterinarian for more information about medications that can reduce calfhood stress and pain related to disbudding, including medication names, dosages, routes of administration, and any withdrawal times.

A few added suggestions:

  • Protect calf from precipitation after paste application so paste doesn’t run down into eyes
  • Cover paste with duct tape if calves are in groups or if there is anything they could rub paste on and contact with another part of their body
  • Always use gloves when using caustic paste and avoid contact with human skin and non-target animal tissues; wash off promptly if paste contacts non-target tissue.
  • If inexperienced about disbudding, learn from someone who is experienced and effective
  • If disbudding with cautery, the key to success is to keep the iron HOT, HOT, HOT.

Try to prioritize disbudding at an early age by making it a routine part of neonatal calf processing. Disbudding calves at 1 to 2 days of age gets this important task accomplished and out of the way so calves can get on with the business of eating, growing, and staying healthy.

A bi-lingual publication that describes another disbudding protocol is available from Oregon State University Extension.


Whatcom County Dairy Education Opportunities

If you have free time between 2:00 and 3:00 pm on November 15 and will be in the Lynden area, drop in at the Fairway Café for a no-host pie, coffee, and chat session with other producers and regional Extension Specialist Susan Kerr. No reservation needed. Among other things, we’ll set the date for future such gatherings.

  • November 16, 2015 Meet, Greet and Eat, Fairway Café, Lynden, 2:00 PM
  • January 20, 2016 Dairy Producer College, Lynden, Mt. Baker Rotary Building

Amber’s Top Ten Tips: Managing Cold Stress in Calves

Now that we made it through one of our hottest summers on record, it’s time for us to turn our attention towards the cold weather that lies ahead. The average mortality rate of heifer calves is approximately 8% on dairies in the United States. Of course, higher incidences of calf morbidity and mortality occur during cold weather conditions when calves expend additional energy to regulate their body temperature, which leads to less energy available for health and growth functions. Take a look at the following tips on calf management during cold weather and consider them as you prepare for the upcoming winter.

What you need to know about cold stress in dairy calves:

  1. Calf Jackets

    Using calf jackets or blankets during a calf’s first two weeks of life increases the calf’s insulation by 52% and may increase average daily gain by up to 0.2 lbs./day.

  2. Thermoneutral Zone

    A calf’s thermoneutral zone is the range of environmental temperatures in which a calf does not need to use additional energy to maintain its body temperature. The thermoneutral zone is 50 – 78 °F for calves less than one month old and 32 – 78 °F for calves more than one month old.

  3. Nesting Scores

    Calf lying in hutch. A thick bed of straw completely covers the anima's legs.
    Nesting score 3; calf’s legs are completely covered with bedding.
    To conserve body heat, calves will burrow their bodies into their bedding (nesting behavior). The ability for calves to exhibit this behavior is scored according to a three-point scale. A nesting score of one means that the calf’s legs are completely visible when the calf lies down; whereas a score of two implies that the calf’s legs are partially visible. Ideally, each calf should receive a score of three so that the calf’s legs are completely covered with bedding.
  4. Water Intake

    Calves need access to at least one to two gallons of clean water every day and offering warm water at least twice a day during cold weather may help calves maintain their internal body temperatures. Restricted water access may decrease weight gain by 38%.

  5. Milk Feedings

    Increasing the number of milk feedings to three times per day or increasing the amount of milk offered by 30% will help ensure that calves have the energy they need when they need it.

  6. Fat Supplementation

    Adding supplemental fat to calf diets during cold weather conditions have been linked to increases in calf growth during the first three weeks of life.

  7. Housing

    Calves need to be sheltered from wet and windy conditions, but adequate airflow is still necessary to minimize ammonia build-up. Ammonia concentrations should be less than 10 ppm (parts per million).

  8. Physiology

    Winter calves have respiration rates and heart rates higher (8.8% and 4.4%, respectively) than calves born in the summer.

  9. Behavior

    Lying behavior decreases by up to 37% when calves are provided wet bedding versus dry bedding. This information encourages us to keep the bedding deep and dry.

  10. Hypothermia

    Shivering and blood shunting (diverting blood flow from the calf’s extremities) are two mechanisms a calf’s body uses to increase muscle heat production and reduce heat loss during cold weather. Early signs of blood shunting in a calf include a cold nose and cold hooves.

July 2015 WSU Dairy Newsletter

Best to be Ready for an Early Corn Silage Harvest This Year

There is no question that this year has been warmer than normal for a majority of locations within the Pacific Northwest. As a result of the increased mean daily temperatures, we are also seeing a rapid increase in the amount of accumulated heat (growing degree day units – GDUs) required for corn maturation. It is only July, but it is time to be thinking about corn silage harvest. Since 2015 has proved to be one of the hottest years on record, temperatures from Snohomish, Lynden, and Sunnyside were assessed to determine the rate of GDU accumulation for 2015 compared to a “historical” period of 2008-2014.

We utilized data what we called historical data for the time period of 2008 to 20014, and compared that to data through July 9th of 2015. The data shown in figures 1, 2, and 3 show that the accumulative GDU by July 9 of this year was at 163%, 165%, and 157% of the 2008 to 2014 average for Snohomish, Lynden, and Sunnyside, respectively.

Corn silage should be harvested according to stage of maturity as judged by milk line development and moisture content of the plants. Getting out in the field early and monitoring the stage of maturity of corn silage will be important to ensure that harvesting is done at the correct time. Walk out in the field and look at a few ears to see what the maturity is now. Get your harvest equipment ready or be in touch with your custom harvester to make sure they are prepared for an earlier harvest.

June 2015 WSU Dairy Newsletter

Cool Temperatures and Large Particle Solids Affect Ammonia Emissions from Land Applied Dairy Manure

We have been studying the factors affecting the emission of ammonia from dairy manure for the past eight years. The major factors that affect ammonia emission at the time of application appear to be: the ambient temperature, manure treatment (anaerobic digestion of manure), large particle solids, and incorporation.

During the summers of 2010, 2011 and 2012 we conducted twenty-two manure application studies looking at the effect that various types of dairy manure had on ammonia emissions when applied to grass which was to be harvested as silage. In particular, we wanted to understand the impact that anaerobic digestion and large particle manure solids had on ammonia emissions. Figure 1 shows the typical pattern of ammonia concentration throughout the day of manure application.

Graph showing NH3 emissions by time of day following application.
Figure 1. Typical NH3 measurement on day of manure application.

Due to the cooler climate of the Pacific Northwest, it is common to apply manure at ambient temperatures below 60 degrees Fahrenheit. We found the that 60 degrees Fahrenheit was a critical temperature as we were not able to observe ammonia emissions on the day of manure application when it was cooler than 60 degrees.

We know from studies with anaerobic digestion (AD) of dairy manure that the amount of ammoniacal nitrogen can be greater in AD manure. This is due to the conversion of organic-nitrogen to ammonia-nitrogen by microbes in the anaerobic digester. This observation led us to assume that AD manure would lose more ammonia when land applied, when compared to non-AD (or raw manure). What we found in 2010 was that since AD manure had the large particle solids removed prior to storage, the AD manure actually had less ammonia emitted after land application than non-AD manure with large particle solids (see Figure 2). The reduced NH3 losses from liquid manure without large particle solids was due to the promotion of manure infiltration into the soil, consequently reducing the manure exposure time on the ground surface.

In 2011, we added an additional manure type, non-AD with large particle solids removed. When this manure type was compared to AD manure, and non-AD manure with solids, it was clear the effect that manure solids have on increasing ammonia emissions. Our data suggest that the ammonia emission were reduced by ~40% (see figure 2) when large particle solids had been removed.

Bar graph showing ~40% increase in ammonia emissions when large particle solids are not removed from manure.
Figure 2. Average ammonia concentrations for manure treatments, ADWOS = anaerobically digested manure without large particle solids, NADWOS = non-AD manure without large particle solids, and NADWS = non-AD manure with large particle solids.

Complete data published in Sun, F., J. H. Harrison, P. Ndegwa, and K. Johnson. 2014. Effect of manure treatment on ammonia and greenhouse gas emissions following surface application. Water, Air, and Soil Pollution. DOI 10.1007/s11270-014-1923-z

Joe Harrison, Livestock Nutrient Management Specialist, WSU Puyallup, jhharrison@wsu.edu

Amber’s Top Ten Tips: Understanding Heat Stress

Heat stress is bad news for dairy cows. We often hear about abnormal heat waves that roll through regions leaving behind millions of dollars of damage, but what about the losses incurred during a typical summer? Across the U.S., the economic losses attributed to heat stress are approximately $100 per cow per year. With summer knocking at our door, have you considered how hot weather impacts the cows on your dairy?

Interesting facts about heat stress in dairy cows:

  1. Temperature-humidity Index (THI)

    THI is commonly used to gauge the severity of heat stress dairy cows experience under specific environmental conditions (ambient temperature and relative humidity). THI ≥ 72 is categorized as heat stress; however, recent research has indicated that the heat stress threshold should be lowered to a THI of 68.

    THI = ambient temperature – [0.55 – (0.55 * relative humidity/100)] * (ambient temperature – 58.8)

    Ambient temperature is recorded in Fahrenheit and relative humidity is recorded as a percentage.

  2. Core Body Temperature

    As THI increases and, subsequently, core body temperatures increase, cows spend more time standing rather than lying down. Cows with rectal body temperatures ≥ 102.2°F (measured in the afternoon) are at risk for decreases in milk production and fertility.

  3. Water Intake

    Cows will consume 35 – 50% more water during heat stress conditions. Ensure cows have access to an adequate supply of clean, fresh water.

  4. Feed Intake

    Heat stress causes decreases in feed intake during the daytime, decreases in feed efficiency, and decreases in nutrient absorption. Nighttime “slug feeding” may lead to higher incidences of acidosis.

  5. Milk Composition

    Cow exposure to environmental heat stress has been linked to higher milk somatic cell counts and bacterial counts, with lower milk fat and protein percentages.

  6. Cooling Strategies

    Natural ventilation, fans, sprinklers/misters, shade access (esp. open lot dairies), and cooling pads all offer heat stress abatement for dairy cows; however, each dairy needs to assess which strategy will work best for each facility. Adjustments to feeding schedules, ration formulations, and stocking densities may also assist with heat stress abatement.

  7. Milk Production

    Depending on the severity of heat stress conditions, cows will decrease their milk production by 10 – 50%.

  8. Reproduction

    Conception rates during heat stress can plummet by almost 20%. For example, a dairy with a typical conception rate of 31% fell to a conception rate of only 12% during hot weather.

  9. Health

    Higher incidences of mastitis, respiratory problems, retained placentas, and higher respiration rates have been diagnosed in cows under heat stress conditions.

  10. Gestation

    Calves exposed to heat stress during the last 45 days of gestation have lower birth weights, lower weaning weights, and depressed immune systems.

Table showing onset of heat stress symptoms at various combinations of temperature and humidity.
Source: Zimbleman and Collier.

V.S. is No B.S.!

On May 29, Dr. Keith Roehr presented a webinar about the 2014 Vesicular Stomatitis (VS) outbreak in Colorado. Dr. Roehr is the Colorado State Veterinarian. He reported that between July 4, 2014 and Jan. 29, 2015, his office made 556 investigations and ultimately quarantined 370 premises that tested positive for VS. The late onset of Colorado’s winter in 2014-15 was blamed for such an extended outbreak duration.

What is VS?

VS is a contagious viral disease of all hoofed animals—particularly equines, swine and cattle; sheep, goats and camelids are affected less often. The virus occasionally spreads to humans and causes a flu-like disease and blisters in rare instances. It is believed to enter a herd via insect vectors (black flies, midges, sand flies, etc.) and then spread primarily through additional insect activity within the herd. Little transmission is believed due to direct livestock contact, animal movement, and mechanical means, such as contaminated equipment and facilities.

Signs of Illness

Cow showing erosions and sloughing of tissue on the lips and tongue.
Photo by Dr. Jeanne Rankin (from http://blogs.extension.org/edenotes/tag/news).
Affected animals have erosions and sloughing of tissue on the lips, tongue (see photo), teats, prepuce, between the toes, and on hoof coronary bands. Blisters and vesicles occur on these areas early in the course of disease but are often missed by human caretakers. Other signs include fever, poor appetite, lethargy, weight loss, drooling, scabbed lesions, and lameness if feet are involved.

Why is VS Important?

VS is present in the U.S. and occasional disease outbreaks occur. Also, although VS is very contagious and can cause many cases of illness on premises, animals rarely die from it. Nevertheless, the disease is particularly important for several reasons:

  • The signs of VS are similar to three foreign animal diseases not present in the U.S.: foot and mouth disease, swine vesicular disease, and vesicular exanthema of swine. It is essential to differentiate VS from these other diseases quickly so the entry of one of these exotic diseases can be identified and dealt with promptly.
  • VS is infectious—outbreaks in the U.S. restrict some international trade until the outbreak is contained.
  • Its similarity to important foreign animal diseases make VS a reportable disease in the U.S.
  • Animals afflicted with VS are in pain, stop eating, lose weight and produce less milk. A widespread outbreak could cause significant animal suffering and economic losses. Dr. Roehr shared that economic losses of dairy farms involved in the Colorado outbreak were over $1M on some farms when decreased production, increased labor, reduced livestock marketing options, diagnosis and treatment costs were considered.

Control Measures

A vaccine for VS is not available in the U.S., so control of biting insects is the major component of VS control and prevention:

  1. Reduce exposure to flies by reducing pasture time.
  2. Eliminate stagnant water or keep livestock away from wet areas where insects of concern are more common.
  3. Use effective approved insect repellents.

To reduce mechanical transmission of the virus, equipment and tools should not be shared between farms. During outbreaks, healthy animals should be monitored closely for early signs of illness (fevers and vesicles) so they can be isolated from other animals quickly.

State and/or federal veterinarians are responsible for making the diagnostic determination in cases of VS. They issue quarantine orders, stopping animal movement to and from affected premises. They also advise owners about disinfection measures and isolation of affected animals to protect unaffected animals on the premise.

Conclusions

VS outbreaks are a reminder for livestock owners to develop, fine tune, or brush the dust off farm biosecurity plans. Livestock owners will be the first line of defense in the event of the entry of a foreign animal disease into the U.S. Early detection is our best hope for containing economically-important diseases such and foot and mouth disease. Monitor your animals regularly for signs of illness and call your veterinarian immediately if you see vesicles, blisters, erosions, or the other signs previously mentioned. Let’s hope it is “only” VS or something more innocuous.

A recording of Dr. Roehr’s webinar is available from Iowa State University Extension and Outreach. He discusses dairy cattle involvement in depth.

For Additional Information

LIVESTOCK OWNERS: If you ever notice a vesicle, blister, ulcer or erosion on an animal’s mouth, teats, prepuce or feet, contact a veterinarian at once. Odds are this is not a foreign animal disease, but if it is, every hour of diagnostic and containment delay means an exponential increase in the cost of the outbreak, in both economic impact and animal suffering.

March 2015 WSU Dairy Newsletter

Amber’s Top Ten Tips: Assessing Dairy Cow Behavior

Cow comfort” and “animal welfare” are two phrases receiving an increased amount of attention from dairy producers across the nation. Have you heard these phrases recently? Do you know what they mean? How do you measure cow comfort? As you consider these questions, let’s start at the beginning: animal behavior. I spent the last seven years working on animal behavior in lizards, horses, goats, and cattle. For the purpose of this article, I will focus on dairy cow behavior. I encourage you to attempt to identify the following ten cow behaviors on your dairy and consider how changes in some of these behaviors may help you identify issues in the herd:

  1. Feeding

    Decreases in the amount of time a cow spends at the feed bunk may indicate metritis, ketosis, or, locomotion disorders.

  2. Isolation

    Isolation behavior (or seclusion from the rest of the herd) may occur prior to calving.

  3. Social

    Cows develop a social hierarchy within a herd. Cows ranked lower in social hierarchy are displaced at the feed bunk more often than cows ranked higher in the social hierarchy.

  4. Estrous

    Restlessness, chin resting on other cows, standing heat, and increases in walking are all behavioral tools used to detect estrus in cows.

  5. Maternal

    Following calving, cows lick their calves to stimulate calf activity and dry the calf’s coat. Cows may also display a flehmen response (elevation of head combined with retraction of the upper lip) towards the calf and amniotic fluids.

  6. Lying

    During the six hours prior to calving, cows will increase their number of lying bouts, but will decrease their overall time spent lying.

  7. Drinking

    Water consumption increases during heat stress conditions, but cows will decrease their time spent drinking prior to calving.

  8. Standing

    One week prior to calving and during the day of calving, cows diagnosed with ketosis increase the amount of time they spend standing.

  9. Stereotypic (repetitive behaviors that hove no obvious function)

    Increases in number of tongue-rolling occurrences within a herd may be associated with restrictive feeding.

  10. Agonistic

    As feeding space at the bunk decreases, the number of aggressive displacements at the bunk increases.


Revisiting Subacute Ruminal Acidosis (SARA)

Subacute Ruminal Acidosis (SARA) is a consequence of our selection for high-producing dairy cattle. To reach their genetic potential for production, these animals need a nutrient dense, high energy diet. Their daily dry matter intake (DMI) is greater than previous average dairy cattle DMI levels. These highly-productive animals are therefore ingesting large quantities of fermentable carbohydrates, which can overwhelm the rumen’s ability to absorb volatile fatty acids (VFAs) and regulate acidity (pH).

Although the definition of SARA can vary, multiple researchers define it as a rumen pH below 5.5 for at least three hours a day. SARA is not rare; one study reported an incidence rate of 26% of mid-lactation and 19% of early lactation cows. It is most common between calving and 150 days of lactation, especially around 90 days as DMI increases with peak milk production. It significantly reduces milk production and components, either directly or indirectly increases culling rates, and can kill cows. Annual industry costs have previously been estimated at $500M to $1B.

Risk Factors for SARA

  • Feeding high dietary levels of rapidly-fermentable carbohydrates (grains, molasses, etc.)
  • Feeding ration by components vs. as a total mixed ration (TMR)
  • Offering few large meals or irregular meals
  • Poorly-mixed TMR
  • Over-mixed TMR
  • Lack of effective fiber in TMR
  • Excessive fiber particle length, resulting in TMR sorting and grain overconsumption
  • Lack of adequate bunk space so not all animals have access to all TMR components
  • Lack of comfortable and sufficient stalls to encourage rumination

Diagnosing SARA

Microscopic image of healthy papillae.
Photo 1. Rumen papillae. These healthy papillae are numerous, long, normal color, and not stunted. They provide the surface area needed for fast absorption of VFAs so rumen pH does not drop excessively. With acute or chronic acidosis, the papillae will be blunted, blackened, missing, or eroded, and VFAs cannot be absorbed effectively. Source: http://arbl.cvmbs.colostate.edu.

All cattle should be monitored closely for signs of SARA up until about day 150 of lactation, when decreasing feed intake reduces their risk. Signs of the condition are vague and subtle, but can include reduced milk production, reduced feed intake, weight loss, lack of cud chewing, milk fat depression, and/or foamy or otherwise abnormal diarrhea that may include intestinal tissue casts. However, some of the most important consequences of SARA may not occur for many weeks. Laminitis (founder) is a common occurrence, and rumenitis from SARA can seed the body with bacteria and result in sole abscesses, sole ulcers, liver abscesses, and even lung abscesses that erode into lung blood vessels and cause the cow to bleed to death.

Rumen pH can be measured in several animals in a group to determine the presence of SARA. Samples should be taken between 6 to 10 hours after the first TMR feeding of the day. Samples taken via stomach tube are often inaccurate, depending on where the sample was taken. A veterinarian can take an accurate sample directly from the rumen. If more than 25% of rumens sampled have a pH < 5.5, SARA is lurking in the group.

Self-correcting Mechanisms

Ruminant saliva contains natural buffers, including bicarbonate. A diet containing sufficient effective fiber stimulates rumination, which increases saliva production and self-buffering of rumen pH. Another self-regulating mechanism is feed intake: as rumen pH decreases and the concentration of osmotically-active particles in the rumen increases, appetite is suppressed—this prevents additional intake of highly-fermentable fiber and gives the rumen time to re-balance pH.

Populations of rumen microbes are highly variable and are determined by pH, feed substrates available, and other factors. Microbes need time to adapt from high fiber dry cow rations to high concentrate lactating rations. A lead time of 3 to 5 weeks is needed to prepare rumens for lactating diets. This will ensure the right microbes are present to digest feeds and regulate the rate of production and consumption of rumen acids (VFAs and lactic acid). Grain feeding results in the production of butyric and propionic VFAs, which stimulates lengthening of rumen papillae. Long and healthy papillae are able to absorb VFAs quickly and moderate rumen pH (photo 1).

Effects of Rumenitis

If the rumen lining is repeatedly exposed to low pH levels (<5.5), it can become inflamed, eroded, ulcerated, scarred, and hyperpigmented; rumen papillae are stunted and lost. The result is reduced absorption of VFAs from the rumen, which further drops pH. This condition is probably painful and reduces feed intake as well. Rumen inflammation causes production of certain proteins and other markers characteristic of inflammatory processes, and their presence is sometimes used to diagnose SARA

Importance of Regular Meals

Irregular feeding schedules, lack of adequate bunk space, prolonged pre-milking or vet check holding times, and other factors that keep cows away from feed can set the stage for SARA. Here’s why: without the continued intake of a high-concentrate ration, rumen pH rises. This can kill certain types of rumen bacteria, particularly those that use lactic acid and help keep pH from falling too low. With less of these bacteria available, the animal is less able to moderate rumen pH when it takes in feed again. Animals that have not had access to the feed bunk for a while often eat an unusually large meal when feed is made available, which also contributes to falling rumen pH.

Low rumen pH decreases the variety of rumen microbes, causing a less stable rumen pH and reducing the animal’s capacity to regulate pH. Below a pH of 5.5, lactate-producing bacteria proliferate and reduce pH even more.

Causes of SARA

  • Insufficient rumen buffering (inadequate effective fiber, DCAD, and/or natural buffers)
  • Excessive highly-fermentable carbohydrates in diet
  • Lack of rumen’s adaptation to a high-concentrate diet

Reducing the Risk of SARA

High roughage/low concentrate rations can eliminate SARA, but they won’t support maximum milk production. Rations should be fine-tuned and not supply more highly-fermentable carbohydrates than needed; contain adequate effective fiber; include buffers such as sodium bicarbonate and the recommended dietary anion-cation difference (DCAD); be re-formulated as needed to adjust for changing dry matter content of different batches of feedstuffs; and possibly include probiotics including yeast and bacteria that use lactic acid.

Corn silage is a known risk factor for SARA. It has variable digestibility and moisture and insufficient long fiber to promote rumination and buffering. It may need to be mixed with additional fiber in the form of dry hay to meet recommended effective fiber and dry matter content in the TMR.

Bunk management is critical to minimizing SARA. Ensure adequate space so all animals have access to the complete TMR, not the dregs that remain from sorting. Check the TMR throughout the day to monitor the degree of sorting that occurs and correct chopping or mixing as needed. Check to be sure the ration formulated on paper is the ration delivered to and eaten by cows. Keep feed in bunks—if bunks are empty, cows that want to eat will have nothing and their rumen pH will not be stable; SARA can ensue.

References

  • Plaizier, J.C., D.O. Krause, G.N. Gozho, & B.W. McBride. 2008. Subacute ruminal acidosis in dairy cows: The physiological causes, incidence and consequences. The Veterinary Journal, 176(1), 21–31. doi:10.1016/j.tvjl.2007.12.016
  • Krause, K.M., & G.R. Oetzel. 2006. Understanding and preventing subacute ruminal acidosis in dairy herds: A review. Animal Feed Science and Technology, 126(3–4), 215–236. doi:10.1016/j.anifeedsci.2005.08.004
  • Enemark, J.M.D. The monitoring, prevention and treatment of sub-acute ruminal acidosis (SARA): A review. 2008. The Veterinary Journal, 176(1), 32–43. doi:10.1016/j.tvjl.2007.12.021

Winter Kill on Grass Fields in Western Washington

Did you notice winter kill on grass fields over the later 2014 – early 2015 time period? If so, the answer may be related to lack of dormancy going into winter period.

Nutrient management is important all times of the year in forage production systems. However, the fall (September) period is the beginning of the annual calendar cycle of adapted grasses, including ryegrass. The grass plant will generate new roots and new growing points in the fall period only to shed those roots during the winter. If grasses are not allowed to transition into a dormancy state in the late fall, such as late October to mid-November, and grass growth remains active then the probability of winterkill increases.

Nutrients such as N in early fall may contribute to continued active fall growth, delaying fall dormancy. So, if we start with a low stubble harvest height in the final cutting, compound the plant mechanism of lower grass sugars and active grass growth from higher soil N availability, then add one below normal, very cold Arctic blast, we have the perfect storm for winterkill. This happened to many grass producers in 1988 resulting in thousands of westside acres of perennial grasses dead. This perfect storm was repeated in the fall and early winter of 2014. As our crops are emerging from winter dormancy and into spring greenup, the results of that perfect storm are clear.

Perennial and annual ryegrasses store the highest amount of sugars in the stem and basal (crown) tissue of any cool-season grasses grown in the PNW. We expect the range of these fructosan sugars to range above 20% to nearly 30%. Fructosan sugars can be thought of as the anti-freeze in these highly productive and high quality westside grasses. Even though the sugar may differ among grass crops, the net result is similar, increased winterhardiness and rapid regrowth after harvesting. Unlike alfalfa and other legumes where the sugar (starch in this case) is stored in the crown and tap root, cool-season grasses store sugars in the basal 3 to 4 inches of the stubble.

Grazing or cutting with machines to close to the ground will remove essential sugars for growth and survival. This is not just in the final fall harvest but all cuttings over the growing season. What sets up the critical fall grass establishment period is the summer. Measure sugar concentrations in the summer and you’ll find them lower than at any time of the growing season. In the fall, sugar levels should be at their highest, not lowest. Another important characteristic in grass management is the inverse interrelationship between nitrogen (Crude Protein) and sugar concentrations. As CP increases sugar concentrations decrease. Decreasing stored sugars reduce winterhardiness in tame cool-season grasses, such as ryegrass. Nutrient management is important all times of the year in forage production systems.

Thus, we never recommend either harvesting or grazing cool-season grasses less than three-inches. For timothy and a couple other grasses, never less than four inches. Thus, lower summer cutting heights reduce sugars proceeding into September, not a prime situation when the plants essentially establish productive potential at this time for the following year. Secondly, to increase September and fall sugar storage in the stubble and in the above ground growth, the plants must conserve sugars to transition into a state of winter dormancy.

On the westside this dormancy level does not need to be as severe or deep as Minnesota and the upper mid-west for winter survival, but westside grass winter dormancy is important. Third, nutrient applications of manure or fertilizer N may prolong fall growth, reduce sugar concentrations and inhibit winter dormancy. Timing of transition is dependent upon fall temperatures, soil temperatures, fall rains, soil moisture status, grass genetics and health of the plant.

Fall is not a time when producers can slack off on their grass management, actually the opposite is true. Fall is when you need to do the best possible job to reduce winterkill injury and enhance rapid, early spring growth.

Finally, as grasses emerge in the spring, they are often lower in sugars than when they entered winter dormancy. Avoid early turnout on to pastures until atl east six to eight inches of growth have been attained. Reduction of stands can occur in summer, when grasses are shedding roots when plants do not have enough sugars for high respiration rates in summer heat then placing the plant in a less than productive state entering the critical fall period.

December 2014 WSU Dairy Newsletter

Greetings and Welcome to Our New Look for the WSU Dairy Newsletter

With this issue of the WSU Dairy Newsletter, we debut a new system for managing our Newsletter. Please provide any feedback in regard to the format and usefulness of this publication to Joe Harrison at jhharrison@wsu.edu.

Dr. Amber Adams-Progar
In addition to the change in the Newsletter format, we would also like to welcome Dr. Amber Adams-Progar, Dairy Extension-Research faculty in the Department of Animal Sciences at WSU Pullman. Amber joined the faculty in June of 2014 and will focus on Animal Well-Being and Calf Management, as well as being a resource for general dairy extension needs in the state. She can be contacted at amber.adams-progar@wsu.edu or 509-335-0673.


Dr Amber Adams-Progar’s Top Ten Tips: Calf Management

After spending the last year and a half working with about 40 dairy farms, and putting over 60,000 miles on the rental car, I have seen a wide variety of calf management strategies. Some ideas were instant successes, some were close to success, and others just flat out failed. When evaluating your calf management practices, keep these 10 things (listed in no particular order) in mind:

  1. Calving area

    Avoid housing sick cows in the calving pen and keep the calving area as clean as possible to limit a newborn calf’s exposure to pathogens.

  2. Location, location, location

    Prevent the transmission of disease from older cattle to calves by housing calves away from older cattle and removing nose-to-nose contact between the two age groups.

  3. Cleanliness of calf environment

    Cleaning the pen/hutch and buckets after each calf decreases bacteria exposure from calf to calf.

  4. Bedding

    Choose bedding that keeps calves clean, but doesn’t irritate the respiratory system.

  5. Ventilation

    Remember to test airflow at calf height and prevent drafty areas that may cause a calf to become chilled.

  6. Water

    Access to clean water during the day improves calf gain and reduces the effects of heat stress.

  7. Nutrition

    Providing sufficient amounts of milk and starter feed that are free of pests, including flies, promotes higher feed intake and better health.

  8. Lighting

    Ensure the natural or artificial lighting is plentiful so calf care managers can easily observe calves for signs of illness.

  9. Colostrum

    Quality of the colostrum should be measured using a Colostrometer or Brix refractometer for assurance that the calf will receive adequate immunity.

  10. Health records

    Maintaining calf treatment records reduces errors in treating calves and reveals calf disease patterns that can be addressed with your veterinarian.


Feeding Pasteurized Waste Milk to Calves

If you have a steady supply of waste milk, you might consider pasteurizing and feeding it to calves. Many studies show this can result in cost savings, improved calf health and increased growth rates.

Definition of Waste Milk

Waste milk includes colostrum, transition milk, high cell count milk, milk withheld due to antibiotic treatment and mastitic milk. It isn’t recommended to feed raw or pasteurized milk that is overtly abnormal or milk with extremely high bacterial loads. Also, because of the possibility of antibiotic residues in waste milk from treated cows, it shouldn’t be fed to animals being raised for meat; this possibility might also discourage some producers from even feeding it to replacement heifers.

Hows and Whys

Milk replacer costs continue to rise and it is not cost-effective to feed salable milk to calves when milk prices are high. Feeding waste milk can meet calves’ nutritional needs by using an otherwise-discarded product. Feeding raw waste milk is not recommended due to its potential to contain a variety of disease-causing organisms (see box).

Pathogens of Concern in Raw Milk

  • Mycobacterium avium subsp. paratuberculosis
  • Salmonella species
  • Mycoplasma species
  • Listeria monocytogenes
  • Campylobacter species
  • Mycobacterium bovis
  • Enterobacter species
  • Staphylococcus species
  • E. coli

Pasteurized waste milk (PWM) greatly reduces the pathogen load to which calves are exposed, but not to the complete reduction achieved through the use of well-managed milk replacers. Growth rates on PWM exceed those of traditional milk replacers but are similar to those of new higher-quality milk replacers. The table below compares the nutritional content of milk, waste milk and milk replacers on a dry matter basis.

Nutritional content of milk, waste milk and milk replacers on a dry matter basis
Source Protein Fat
Milk 24 to 27% 28 to 36%
Waste milk 25 to 30% 25 to 35%
Milk replacer 18 to 29% 15 to 20%

Economic analyses found that feeding PWM was cost effective when at least 23 calves were fed in one study and 60 in another. This indicates that PWM feeding is probably not cost effective for smaller operations.

It is recommended to collect and store waste milk in a dedicated bulk tank so the pooled milk can make the nutritional content more uniform and dilute any milk containing antibiotics. Waste milk should be cooled to at least 45°F before and after pasteurization and protected from contamination after pasteurization. This bulk tank should be cleaned and sanitized just like the salable milk tank.

Advantages and Disadvantages

Overview of the potential advantages and disadvantages of feeding PWM to calves.
Advantages Disadvantages
  • Probable feed cost savings, especially in comparison to high quality commercial milk replacers.
  • Compared to raw milk, improved calf health (especially scours and pneumonia) due to reduced exposure to disease-causing agents.
  • Faster growth due to higher nutritional content of waste milk vs. most milk replacers.
  • Effective pasteurization kills up to 99% of bacteria and deactivates toxins
  • Beneficial use of otherwise-discarded products.
  • Various immune factors in whole milk may survive pasteurization and provide protection not available via milk replacer.
  • Cost of pasteurizer and energy to operate it.
  • Increased trained labor for managing, monitoring and cleaning pasteurizer (if not self cleaning).
  • Need to cool and store milk ASAP before and after pasteurization.
  • Dependence on regular volume of useable waste milk.
  • Pasteurization process can fail so must be monitored routinely.
  • Variable nutritional content of batches, especially in small herds.
  • Potential feeding of low-level antibiotics to calves.

Pasteurization Options

Most pasteurizers are either standard batch pasteurizers (commercial or homemade) or commercial high temperature/short time (HTST) continuous-flow machines. Batch units heat a batch of milk to 145°F for 30 min.; the milk is cooled and fed. In HTST systems, milk is rapidly heated to 161°F for 15 sec., then cooled to be fed or held. These units pasteurize milk more quickly, thoroughly and dependably than batch systems, but they are harder to clean unless automated. The price of commercial units continues to drop with increasing acceptance on farms. Colostrum can be pasteurized, but it must be done at a lower temperature for a longer time so immunoglobulins essential for neonatal calf health will not be destroyed; 140°F for 60 min. is recommended.

Conclusions, Problem Solving and Cautions

As you can see, each farm needs to weigh the pros and cons of feeding milk replacer, raw waste milk, salable raw milk or PWM to calves. The ultimate decision is a balance between disease control, feed costs and labor; this decision can fluctuate with market price changes. Here is a summary of suggestions and considerations regarding the feeding of PWM:

  • Do not use heavily contaminated waste milk or visibly mastitic milk for calves.
  • Wait to feed PWM until calves are over one day old.
  • Avoid switching calves between PWM and milk replacer. Estimate expected upcoming waste milk volumes and assign calves to either PWM or milk replacer feeding if there isn’t enough PWN for all. If calves must be switched, try to do so after calves are at least three weeks old.
  • If waste milk volume is low, high somatic cell count milk could be included.
  • Don’t collect milking system flush water with waste milk to be fed to calves; this will dilute milk nutrients excessively.
  • Do not consider pasteurization a shortcut to sanitation, milk handling and best feeding practices. All milk feeding equipment (buckets, bottles, nipples, etc.) still need to be cleaned and sanitized or the disease-reduction benefits of pasteurization will be lost.
  • Agitate and mix stored batches close to feeding time or fat will separate from milk, causing some calves to receive too little fat and others too much.
  • Because pasteurization greatly reduces pathogen loads in milk but does not sterilize it, it is still recommended to house calves individually to prevent suckling and possible disease transmission.
  • Employee training and understanding of pasteurization is essential.
  • Routinely monitor the pasteurization process through temperature checks and milk cultures for quality testing (goal: standard plate count <20,000 cfu/ml).
  • Reminder: calves fed PWM.
  • may ingest antibiotics in milk from treated cows, so withholding periods must be observed.
  • Suggestion: visit with producers who are successful with waste milk pasteurization systems to observe the process, ask questions and learn from their experience.

Postscript

On a related note, a spreadsheet that helps decide when it is more cost effective to feed milk replacer vs. salable whole milk is available from Penn State Extension. If you do not have access to the internet, contact me and I’ll be happy to work through the spreadsheet with you.

Useful links for additional information


Western Dairy Management Conference

March 3 – March 5, 2015 | Reno, NV

John Ascuaga’s Nugget
1100 Nugget Avenue
Reno, NV 89431
800-648-1177

Conference Schedule

Registration

  • Tuesday, March 3: 10:00 AM – 5:30 PM
  • Wednesday, March 4 & Thursday, March 5: 6:30 AM to 5:00 PM

Seminar Schedule

  • Tuesday, March 3: 1:30 PM – 5:30 PM
  • Wednesday, March 4 & Thursday, March 5: 8:00 AM – 5:40 PM

Opening Reception

  • Tuesday, March 3: 5:30 PM – 7:00 PM

Registration

Go to the Western Dairy Management Conference website and complete your registration online. You can also register by mail. Complete and return the attached registration form (one form PER PERSON) along with payment. The conference fee is $390 per person if postmarked by February 1, 2015.

After February 1 the registration fee is $425. Student Registration is $200.


Waste to Worth 2015

March 30 – April 3, 2015 | Seattle, WA

You are invited to attend the International Conference on Livestock & Poultry Environmental Quality

A national network of agri-professionals addressing issues related to air, water, soil, and climate.

Details on registration, hotel accommodations, sponsorship, vendor display registration, program, and tours a the Waste to Worth conference website.

Who should attend?

  • Extension agents & specialists
  • Farmers & producers
  • NRCS staff
  • Technical service providers
  • Consultants
  • Regulatory & policy advisors
  • Commodity groups
  • Environmental NGOs
  • Technology providers
  • Researchers
  • Vendors